Commercial Land
Concourse Pkwy Hoover, AL 35244
Concourse Pkwy Hoover, AL 35244
Details & Description
Property Highlights
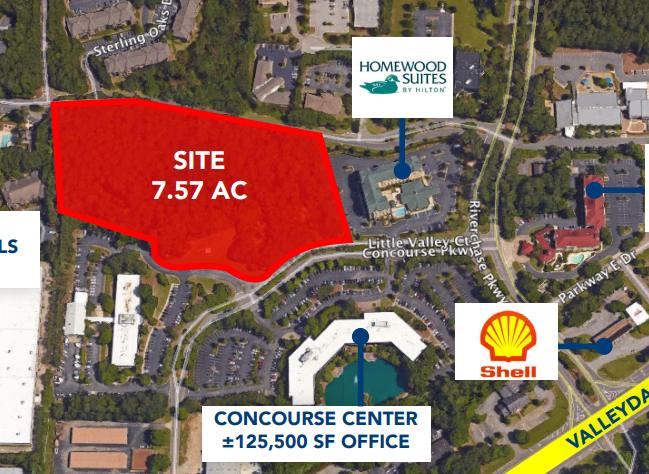
- • North Shelby County - Riverchase Address
- • Easy access to I-65 and Highway 31
- • Growing High Traffic Area/Communities
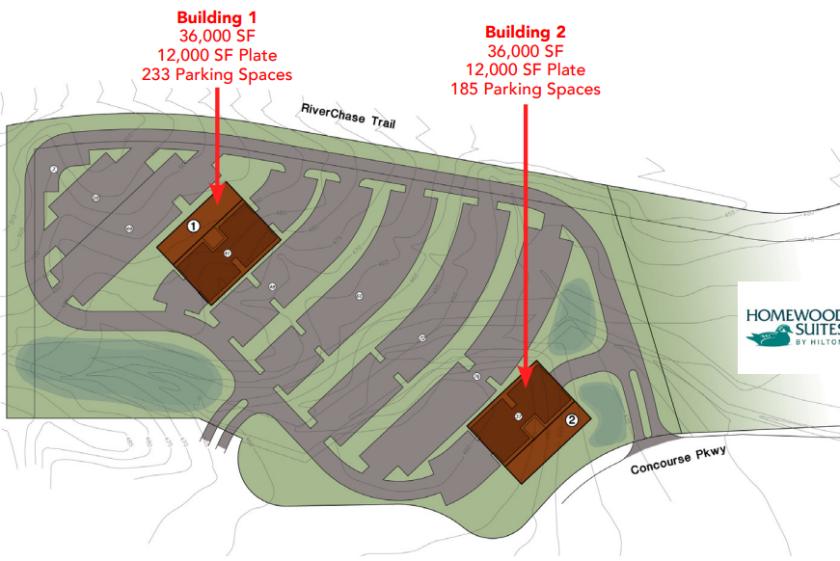
- • Covered parking and excellent parking ratio
Listing Agents

Charlie Norton
O: 205-458-8116
M: 205-458-8116
cnorton@harbertrealty.com
O: 205-458-8116
M: 205-458-8116
cnorton@harbertrealty.com
While we strive to provide the most accurate information, all listing information, and demographic data, is provided by third-parties. As such, MyEListing will not be responsible for the accuracy of the information. It is strongly recommended that you verify all information with the listing agent, and any relevant agencies, prior to making any decisions.