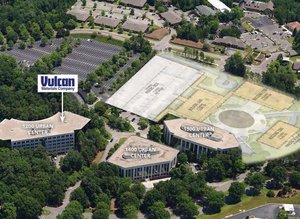
1-Mile | 3-Miles | 5-Miles | ||
---|---|---|---|---|
Total Population | 3,767 | 32,576 | 61,707 | |
Population Median Age | 41 | 40 | 40 | |
Population by Age | 0-9 Yrs | 381 (10%) | 3470 (10%) | 6814 (11%) |
10-19 Yrs | 484 (12%) | 3936 (12%) | 7287 (11%) | |
20-29 Yrs | 453 (12%) | 4911 (15%) | 9064 (14%) | |
30-39 Yrs | 509 (13%) | 3631 (11%) | 7825 (12%) | |
40-49 Yrs | 416 (11%) | 4393 (13%) | 7806 (12%) | |
50-59 Yrs | 500 (13%) | 4721 (14%) | 9138 (14%) | |
60-69 Yrs | 565 (14%) | 4304 (13%) | 7610 (12%) | |
70+ Yrs | 458 (12%) | 3210 (9%) | 6164 (9%) | |
Median HH Income | $74,172 | $86,412 | $87,598 | |
Total Household Income | < 24K | 150 (9%) | 1661 (12%) | 2834 (11%) |
25-49K | 315 (20%) | 2157 (16%) | 3965 (15%) | |
50-74K | 325 (20%) | 2082 (15%) | 4221 (16%) | |
75-99K | 132 (8%) | 1600 (12%) | 3243 (12%) | |
100-199K | 379 (24%) | 3737 (28%) | 7391 (29%) | |
200K+ | 257 (16%) | 2024 (15%) | 3655 (14%) | |
Highest Education Level | No Diploma | 105 | 575 | 1171 |
Diploma or GED | 276 | 2507 | 4631 | |
Some College | 527 | 4590 | 8546 | |
Assoc. Degree | 156 | 1657 | 2822 | |
Bachelors Degree | 1056 | 8915 | 17122 | |
Higher Degree | 615 | 4719 | 9434 | |
Total Housing Units | 1,685 | 14,556 | 28,189 | |
--Owner-Occupied | 1,188 | 8,668 | 16,692 | |
--Renter-Occupied | 370 | 4,593 | 8,618 | |
Owner-Occupied Values | < 100K | 9 | 163 | 432 |
100-199K | 185 | 789 | 1950 | |
200-299K | 361 | 2243 | 4500 | |
300-399K | 219 | 2275 | 4372 | |
400-499K | 192 | 1684 | 2667 | |
500K+ | 223 | 1515 | 2770 | |
Total Working Age Population | 3,046 | 26,563 | 50,118 | |
In Work Force | 2,048 | 18,232 | 34,509 | |
Not In Work Force | 998 | 8,331 | 15,609 | |
Workforce Employed | 1,890 | 17,506 | 33,077 | |
Workforce Unemployed | 154 | 678 | 1,356 | |
Civlian Workforce | 2,044 | 18,184 | 34,433 | |
Military Workforce | 4 | 48 | 76 | |
Total Households | 1,558 | 13,261 | 25,310 | |
Family Households | 1,124 | 8,914 | 16,789 | |
Non-Family Households | 434 | 4,347 | 8,521 | |
Married Couple | 962 | 7,661 | 14,512 | |
Other Family | 162 | 1,253 | 2,277 | |
Married w/Child | 381 | 3,022 | 5,748 | |
Single Male w/Child | 6 | 172 | 325 | |
Single Female w/Child | 79 | 499 | 894 |
Population Change Last Two Decades - Plus Projection
2000 | % | 2010 | % | 2020 | % | 2030 | |
---|---|---|---|---|---|---|---|
Alabama | 4,447,100 | +7 | 4,779,736 | +3 | 4,940,253 | +4 | 5,124,380 |
Shelby County | 143,293 | +36 | 195,085 | +15 | 224,628 | +13 | 253,485 |
Jefferson County | 662,047 | -1 | 658,466 | +1 | 662,458 | 0 | 665,244 |
Total Working Age Population:
Total Households:
Total Working Age Population:
Total Households:
Total Working Age Population:
Total Households: