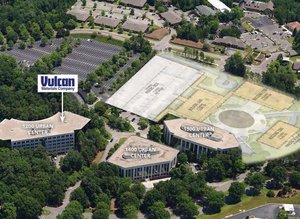
1-Mile | 3-Miles | 5-Miles | ||
---|---|---|---|---|
Total Population | 2,070 | 29,850 | 102,819 | |
Population Median Age | 40 | 39 | 39 | |
Population by Age | 0-9 Yrs | 280 (13%) | 3923 (13%) | 12192 (11%) |
10-19 Yrs | 258 (12%) | 3995 (13%) | 12192 (11%) | |
20-29 Yrs | 214 (10%) | 3609 (12%) | 15072 (14%) | |
30-39 Yrs | 273 (13%) | 4208 (14%) | 14340 (13%) | |
40-49 Yrs | 266 (12%) | 3644 (12%) | 12917 (12%) | |
50-59 Yrs | 274 (13%) | 3965 (13%) | 13148 (12%) | |
60-69 Yrs | 287 (13%) | 3396 (11%) | 12113 (11%) | |
70+ Yrs | 219 (10%) | 3109 (10%) | 10845 (10%) | |
Median HH Income | $121,331 | $98,286 | $76,694 | |
Total Household Income | < 24K | 77 (9%) | 1255 (10%) | 7482 (16%) |
25-49K | 64 (8%) | 1719 (14%) | 7243 (16%) | |
50-74K | 94 (12%) | 1545 (12%) | 7054 (15%) | |
75-99K | 98 (12%) | 1604 (13%) | 5660 (12%) | |
100-199K | 247 (31%) | 3461 (28%) | 9989 (22%) | |
200K+ | 202 (25%) | 2441 (20%) | 6898 (15%) | |
Highest Education Level | No Diploma | 46 | 494 | 3002 |
Diploma or GED | 75 | 1656 | 8415 | |
Some College | 224 | 3083 | 11927 | |
Assoc. Degree | 75 | 972 | 3826 | |
Bachelors Degree | 519 | 8098 | 25671 | |
Higher Degree | 501 | 6320 | 19692 | |
Total Housing Units | 851 | 13,536 | 50,485 | |
--Owner-Occupied | 649 | 9,054 | 27,454 | |
--Renter-Occupied | 135 | 2,971 | 16,874 | |
Owner-Occupied Values | < 100K | 20 | 376 | 2070 |
100-199K | 99 | 1428 | 4924 | |
200-299K | 99 | 1446 | 4905 | |
300-399K | 146 | 1602 | 4224 | |
400-499K | 93 | 1162 | 3242 | |
500K+ | 192 | 3040 | 8089 | |
Total Working Age Population | 1,617 | 23,463 | 83,538 | |
In Work Force | 1,074 | 15,752 | 55,590 | |
Not In Work Force | 543 | 7,711 | 27,948 | |
Workforce Employed | 1,032 | 15,147 | 53,116 | |
Workforce Unemployed | 40 | 577 | 2,417 | |
Civlian Workforce | 1,071 | 15,724 | 55,533 | |
Military Workforce | 3 | 28 | 57 | |
Total Households | 783 | 12,024 | 44,327 | |
Family Households | 610 | 8,089 | 26,010 | |
Non-Family Households | 173 | 3,936 | 18,317 | |
Married Couple | 525 | 6,838 | 20,607 | |
Other Family | 85 | 1,251 | 5,403 | |
Married w/Child | 210 | 3,022 | 7,968 | |
Single Male w/Child | 5 | 149 | 594 | |
Single Female w/Child | 36 | 497 | 2,375 |
Population Change Last Two Decades - Plus Projection
2000 | % | 2010 | % | 2020 | % | 2030 | |
---|---|---|---|---|---|---|---|
Alabama | 4,447,100 | +7 | 4,779,736 | +3 | 4,940,253 | +4 | 5,124,380 |
Shelby County | 143,293 | +36 | 195,085 | +15 | 224,628 | +13 | 253,485 |
Jefferson County | 662,047 | -1 | 658,466 | +1 | 662,458 | 0 | 665,244 |
Total Working Age Population:
Total Households:
Total Working Age Population:
Total Households:
Total Working Age Population:
Total Households: