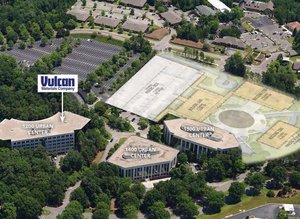
1-Mile | 3-Miles | 5-Miles | ||
---|---|---|---|---|
Total Population | 1,966 | 28,468 | 100,145 | |
Population Median Age | 39 | 39 | 39 | |
Population by Age | 0-9 Yrs | 276 (14%) | 3710 (13%) | 11916 (11%) |
10-19 Yrs | 248 (12%) | 3790 (13%) | 11974 (11%) | |
20-29 Yrs | 209 (10%) | 3438 (12%) | 14440 (14%) | |
30-39 Yrs | 275 (13%) | 3971 (13%) | 13870 (13%) | |
40-49 Yrs | 259 (13%) | 3530 (12%) | 12573 (12%) | |
50-59 Yrs | 257 (13%) | 3794 (13%) | 12841 (12%) | |
60-69 Yrs | 249 (12%) | 3251 (11%) | 11921 (11%) | |
70+ Yrs | 195 (9%) | 2983 (10%) | 10612 (10%) | |
Median HH Income | $119,865 | $98,420 | $78,698 | |
Total Household Income | < 24K | 74 (9%) | 1191 (10%) | 6931 (16%) |
25-49K | 64 (8%) | 1665 (14%) | 6874 (15%) | |
50-74K | 95 (12%) | 1479 (12%) | 6869 (15%) | |
75-99K | 91 (12%) | 1512 (13%) | 5600 (13%) | |
100-199K | 230 (30%) | 3307 (28%) | 9905 (23%) | |
200K+ | 188 (25%) | 2350 (20%) | 6826 (15%) | |
Highest Education Level | No Diploma | 47 | 462 | 2736 |
Diploma or GED | 72 | 1543 | 7922 | |
Some College | 220 | 3008 | 11538 | |
Assoc. Degree | 70 | 942 | 3744 | |
Bachelors Degree | 485 | 7771 | 25393 | |
Higher Degree | 456 | 5985 | 19309 | |
Total Housing Units | 804 | 13,039 | 48,768 | |
--Owner-Occupied | 596 | 8,551 | 27,072 | |
--Renter-Occupied | 147 | 2,954 | 15,934 | |
Owner-Occupied Values | < 100K | 19 | 353 | 1807 |
100-199K | 86 | 1257 | 4858 | |
200-299K | 87 | 1322 | 4908 | |
300-399K | 137 | 1594 | 4211 | |
400-499K | 90 | 1164 | 3238 | |
500K+ | 177 | 2861 | 8050 | |
Total Working Age Population | 1,520 | 22,420 | 81,199 | |
In Work Force | 1,024 | 15,055 | 54,084 | |
Not In Work Force | 496 | 7,366 | 27,115 | |
Workforce Employed | 985 | 14,457 | 51,721 | |
Workforce Unemployed | 37 | 569 | 2,304 | |
Civlian Workforce | 1,021 | 15,025 | 54,026 | |
Military Workforce | 3 | 29 | 58 | |
Total Households | 743 | 11,505 | 43,006 | |
Family Households | 572 | 7,739 | 25,518 | |
Non-Family Households | 171 | 3,766 | 17,488 | |
Married Couple | 491 | 6,567 | 20,446 | |
Other Family | 81 | 1,172 | 5,071 | |
Married w/Child | 208 | 2,872 | 7,954 | |
Single Male w/Child | 5 | 150 | 580 | |
Single Female w/Child | 35 | 459 | 2,225 |
Population Change Last Two Decades - Plus Projection
2000 | % | 2010 | % | 2020 | % | 2030 | |
---|---|---|---|---|---|---|---|
Alabama | 4,447,100 | +7 | 4,779,736 | +3 | 4,940,253 | +4 | 5,124,380 |
Shelby County | 143,293 | +36 | 195,085 | +15 | 224,628 | +13 | 253,485 |
Jefferson County | 662,047 | -1 | 658,466 | +1 | 662,458 | 0 | 665,244 |
Total Working Age Population:
Total Households:
Total Working Age Population:
Total Households:
Total Working Age Population:
Total Households: