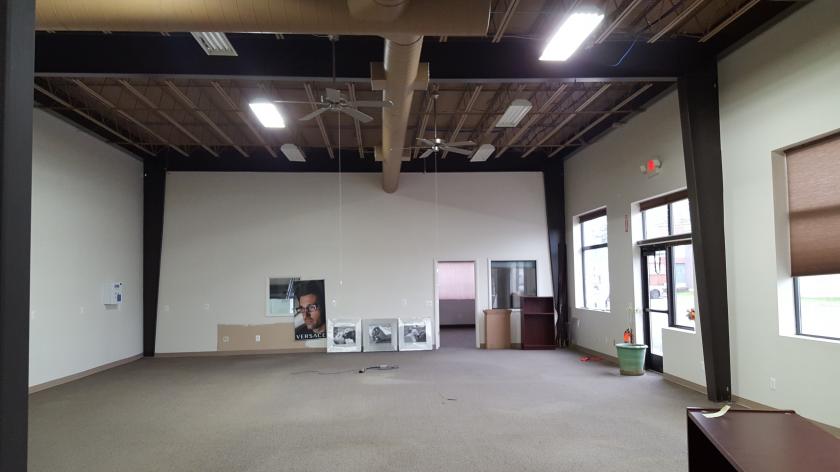
1240 Lyell Avenue is a two-story, 6,060 SF building featuring modern retail/office/medical space. It has a metal exterior with an attractive facade, a stunning two-story entrance and an open floor plan with high ceilings.
The second floor (2,636 SF) is available & ideal for an office/medical tenant.
Landlord willing to tailor space to tenant needs
40+ parking spaces available
Electric car charging stations available
1/2 mile from I-490
Average daily traffic: 15,300+ VPD on Lyell Avenue
Convenient to multiple restaurants, banks and grocery shopping (Wegmans, Save-a-Lot, Aldi, etc.)
CONTACT: Rebecca Guelli, Licensed Real Estate Associate Broker – 585.370-8140
No part of this information may be copied, reproduced, repurposed, or screen-captured for any commercial purpose without prior written authorization from MyEListing.
While we strive to provide the most accurate information, all listing information, and demographic data, is provided by third-parties. As such, MyEListing will not be responsible for the accuracy of the information. It is strongly recommended that you verify all information with the listing agent, and any relevant agencies, prior to making any decisions.
What is the building size of this Office property in Rochester, NY?
The size of the building/unit at 1240 Lyell Avenue in Rochester is 2,636 square feet
How much land does the Rochester, NY property at 1240 Lyell Avenue include?
1240 Lyell Avenue in Rochester includes 1.000 acres of land
What kind of Office is the propery at 1240 Lyell Avenue?
The property at 1240 Lyell Avenue Rochester, NY 14606 is listed as a Professional Office property
What is the population within 1 mile of 1240 Lyell Avenue in Rochester?
The population within 1 mile of 1240 Lyell Avenue Rochester, NY 14606 is 12,181 people.
Who do I contact for questions about 1240 Lyell Avenue?
You should contact the listing agent,
Rebecca Guelli, for any details regarding this commercial listing.