PROPERTY HIGHLIGHTS
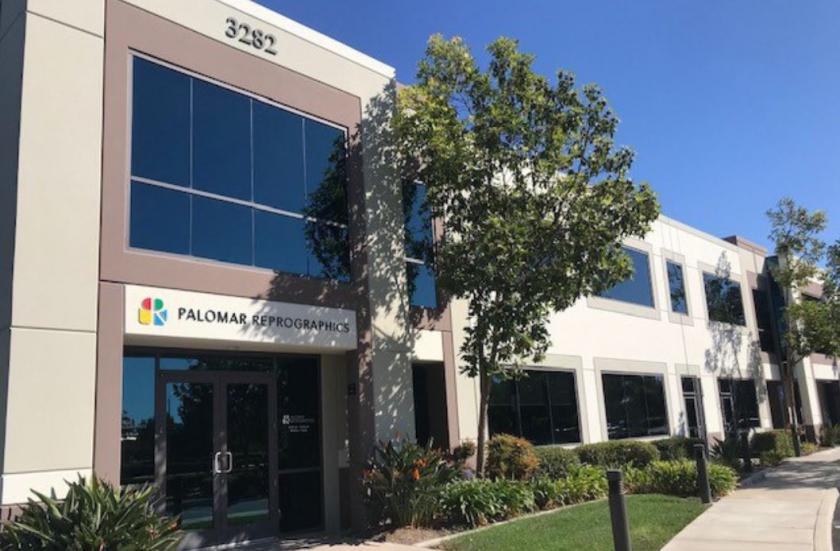
- Modern 2008 Architecture & Construction
- Central Carlsbad Location
- Minutes to Palomar Airport Road, I-5 and Hwy 78
- Close Proximity to Restaurants & Retail
- 2nd Floor Space with Westward Views
- Extensive Window/Glass Use
- Lots of Natural Light
- 3 Executive Offices & Large Open Bullpen
- 2 Kitchenettes/Break Areas
- 1 Private Restroom
- Flexible Lease Terms
***CONTACT LISTING BROKERS FOR MORE INFORMATION***
No part of this information may be copied, reproduced, repurposed, or screen-captured for any commercial purpose without prior written authorization from MyEListing.
While we strive to provide the most accurate information, all listing information, and demographic data, is provided by third-parties. As such, MyEListing will not be responsible for the accuracy of the information. It is strongly recommended that you verify all information with the listing agent, and any relevant agencies, prior to making any decisions.
What is the building size of this commercial Industrial property?
The size of this lease property at '.3282 Grey Hawk Court.' is 8396 square feet
What kind of Industrial is the propery at 3282 Grey Hawk Court?
The property at 3282 Grey Hawk Court Carlsbad, CA 92010 is listed as a Warehouse Industrial property
What is the population within 1 mile of 3282 Grey Hawk Court in Carlsbad?
The population within 1 mile of 3282 Grey Hawk Court Carlsbad, CA 92010 is 9,393 people.
Who do I contact for questions about 3282 Grey Hawk Court?
You should contact the listing agent,
James Bengala, for any details regarding this commercial listing.