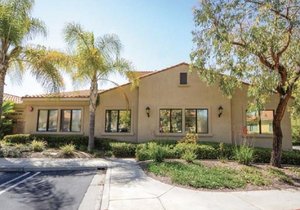
1-Mile | 3-Miles | 5-Miles | ||
---|---|---|---|---|
Total Population | 11,832 | 119,749 | 282,243 | |
Population Median Age | 48 | 44 | 41 | |
Population by Age | 0-9 Yrs | 899 (7%) | 12011 (10%) | 31808 (11%) |
10-19 Yrs | 818 (6%) | 11393 (9%) | 31303 (11%) | |
20-29 Yrs | 1391 (11%) | 14483 (12%) | 35149 (12%) | |
30-39 Yrs | 1387 (11%) | 15060 (12%) | 39010 (13%) | |
40-49 Yrs | 1257 (10%) | 14519 (12%) | 38586 (13%) | |
50-59 Yrs | 1395 (11%) | 15905 (13%) | 40333 (14%) | |
60-69 Yrs | 1706 (14%) | 15490 (12%) | 31352 (11%) | |
70+ Yrs | 2980 (25%) | 20889 (17%) | 34701 (12%) | |
Median HH Income | $58,120 | $81,486 | $96,269 | |
Total Household Income | < 24K | 1113 (20%) | 7134 (15%) | 12763 (11%) |
25-49K | 1180 (22%) | 7725 (16%) | 14220 (13%) | |
50-74K | 915 (17%) | 7365 (15%) | 14971 (14%) | |
75-99K | 577 (10%) | 5378 (11%) | 13311 (12%) | |
100-199K | 1209 (22%) | 13521 (28%) | 34245 (32%) | |
200K+ | 327 (6%) | 6115 (12%) | 17049 (15%) | |
Highest Education Level | No Diploma | 900 | 7294 | 12090 |
Diploma or GED | 1589 | 13172 | 27796 | |
Some College | 2065 | 18735 | 41125 | |
Assoc. Degree | 830 | 7967 | 17692 | |
Bachelors Degree | 2756 | 27172 | 66541 | |
Higher Degree | 1454 | 15751 | 38901 | |
Total Housing Units | 5,829 | 50,515 | 113,191 | |
--Owner-Occupied | 3,427 | 31,583 | 67,347 | |
--Renter-Occupied | 1,893 | 15,656 | 39,212 | |
Owner-Occupied Values | < 100K | 327 | 1614 | 2094 |
100-199K | 365 | 2173 | 2375 | |
200-299K | 673 | 3359 | 4310 | |
300-399K | 555 | 3756 | 6094 | |
400-499K | 455 | 3457 | 6581 | |
500K+ | 1053 | 17223 | 45892 | |
Total Working Age Population | 10,420 | 100,661 | 230,986 | |
In Work Force | 5,611 | 61,649 | 151,579 | |
Not In Work Force | 4,808 | 39,012 | 79,406 | |
Workforce Employed | 5,305 | 58,932 | 144,390 | |
Workforce Unemployed | 306 | 2,700 | 7,130 | |
Civlian Workforce | 5,611 | 61,632 | 151,520 | |
Military Workforce | 0 | 17 | 59 | |
Total Households | 5,320 | 47,238 | 106,559 | |
Family Households | 2,784 | 29,169 | 72,053 | |
Non-Family Households | 2,536 | 18,069 | 34,507 | |
Married Couple | 2,182 | 23,399 | 58,070 | |
Other Family | 602 | 5,770 | 13,982 | |
Married w/Child | 555 | 8,274 | 23,904 | |
Single Male w/Child | 72 | 619 | 1,817 | |
Single Female w/Child | 140 | 1,699 | 4,190 |
Population Change Last Two Decades - Plus Projection
2000 | % | 2010 | % | 2020 | % | 2030 | |
---|---|---|---|---|---|---|---|
California | 33,871,648 | +10 | 37,253,956 | +9 | 40,467,295 | +8 | 43,631,295 |
Orange County | 2,846,289 | +6 | 3,010,232 | +8 | 3,257,087 | +5 | 3,431,096 |
Total Working Age Population:
Total Households:
Total Working Age Population:
Total Households:
Total Working Age Population:
Total Households: