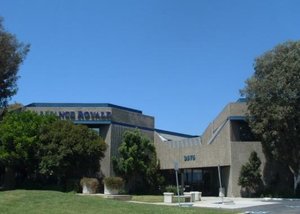
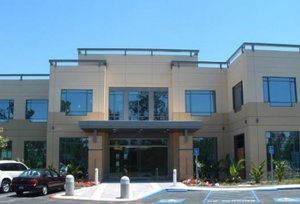
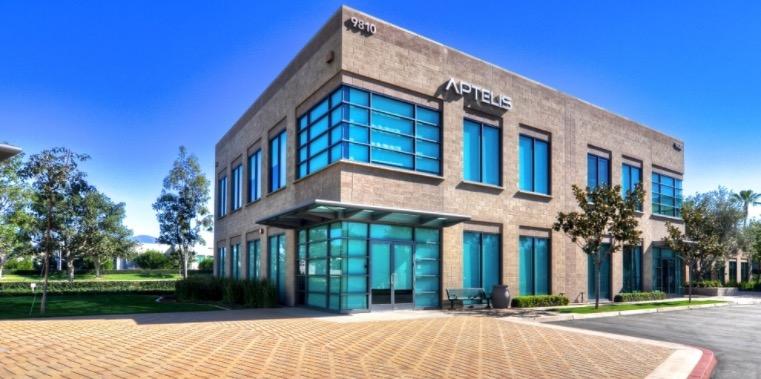
1-Mile | 3-Miles | 5-Miles | ||
---|---|---|---|---|
Total Population | 11,094 | 121,195 | 305,857 | |
Population Median Age | 34 | 37 | 38 | |
Population by Age | 0-9 Yrs | 1540 (13%) | 16147 (13%) | 36291 (11%) |
10-19 Yrs | 964 (8%) | 15109 (12%) | 40011 (13%) | |
20-29 Yrs | 2006 (18%) | 16806 (13%) | 45919 (15%) | |
30-39 Yrs | 2845 (25%) | 19735 (16%) | 44737 (14%) | |
40-49 Yrs | 1533 (13%) | 17872 (14%) | 43759 (14%) | |
50-59 Yrs | 1087 (9%) | 15221 (12%) | 38079 (12%) | |
60-69 Yrs | 584 (5%) | 10522 (8%) | 28142 (9%) | |
70+ Yrs | 536 (4%) | 9784 (8%) | 28920 (9%) | |
Median HH Income | $92,066 | $101,049 | $96,692 | |
Total Household Income | < 24K | 717 (14%) | 6070 (13%) | 16129 (14%) |
25-49K | 453 (9%) | 4735 (10%) | 13950 (12%) | |
50-74K | 741 (15%) | 5612 (12%) | 14329 (12%) | |
75-99K | 756 (15%) | 5709 (12%) | 13453 (11%) | |
100-199K | 1648 (33%) | 14923 (33%) | 35107 (31%) | |
200K+ | 539 (11%) | 7618 (17%) | 19197 (17%) | |
Highest Education Level | No Diploma | 165 | 3668 | 10239 |
Diploma or GED | 910 | 8008 | 20285 | |
Some College | 1107 | 11894 | 31474 | |
Assoc. Degree | 647 | 5480 | 14838 | |
Bachelors Degree | 3238 | 31832 | 75340 | |
Higher Degree | 2047 | 22109 | 54514 | |
Total Housing Units | 5,168 | 46,882 | 119,302 | |
--Owner-Occupied | 1,155 | 22,139 | 60,464 | |
--Renter-Occupied | 3,700 | 22,528 | 51,702 | |
Owner-Occupied Values | < 100K | 8 | 551 | 1503 |
100-199K | 0 | 387 | 1379 | |
200-299K | 111 | 498 | 2632 | |
300-399K | 177 | 1074 | 3694 | |
400-499K | 103 | 1737 | 5187 | |
500K+ | 757 | 17890 | 46069 | |
Total Working Age Population | 8,979 | 95,736 | 246,323 | |
In Work Force | 6,281 | 61,318 | 155,085 | |
Not In Work Force | 2,698 | 34,418 | 91,238 | |
Workforce Employed | 5,921 | 58,254 | 147,414 | |
Workforce Unemployed | 355 | 3,008 | 7,578 | |
Civlian Workforce | 6,276 | 61,262 | 154,992 | |
Military Workforce | 5 | 56 | 93 | |
Total Households | 4,854 | 44,667 | 112,166 | |
Family Households | 2,882 | 31,569 | 74,803 | |
Non-Family Households | 1,973 | 13,098 | 37,363 | |
Married Couple | 2,378 | 25,036 | 60,050 | |
Other Family | 504 | 6,533 | 14,753 | |
Married w/Child | 1,159 | 12,892 | 29,227 | |
Single Male w/Child | 97 | 886 | 1,810 | |
Single Female w/Child | 121 | 2,267 | 4,781 |
Population Change Last Two Decades - Plus Projection
2000 | % | 2010 | % | 2020 | % | 2030 | |
---|---|---|---|---|---|---|---|
California | 33,871,648 | +10 | 37,253,956 | +9 | 40,467,295 | +8 | 43,631,295 |
Orange County | 2,846,289 | +6 | 3,010,232 | +8 | 3,257,087 | +5 | 3,431,096 |
Total Working Age Population:
Total Households:
Total Working Age Population:
Total Households:
Total Working Age Population:
Total Households: