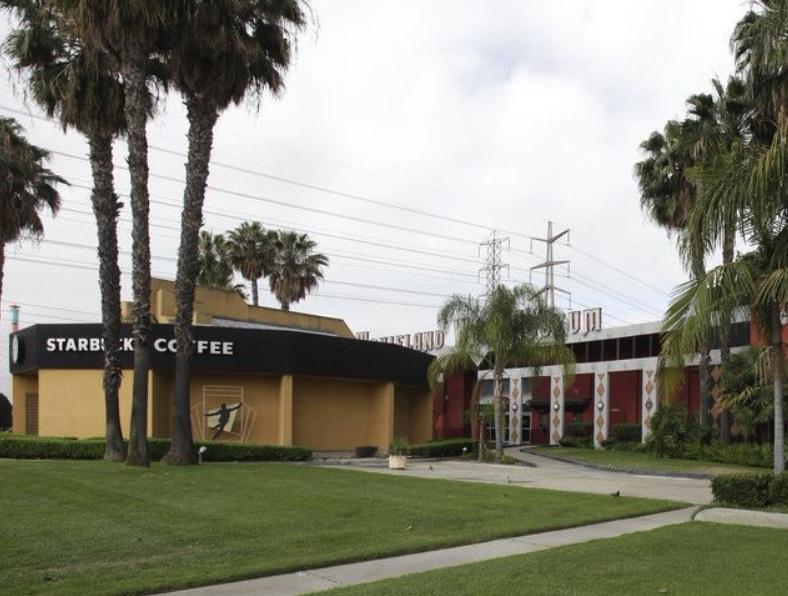
1-Mile | 3-Miles | 5-Miles | ||
---|---|---|---|---|
Total Population | 21,811 | 254,288 | 638,401 | |
Population Median Age | 37 | 37 | 38 | |
Population by Age | 0-9 Yrs | 2913 (13%) | 32085 (12%) | 77750 (12%) |
10-19 Yrs | 2776 (12%) | 34614 (13%) | 85614 (13%) | |
20-29 Yrs | 3122 (14%) | 39640 (15%) | 96308 (15%) | |
30-39 Yrs | 3375 (15%) | 35812 (14%) | 85605 (13%) | |
40-49 Yrs | 2736 (12%) | 34286 (13%) | 86294 (13%) | |
50-59 Yrs | 3033 (13%) | 33049 (12%) | 83801 (13%) | |
60-69 Yrs | 2015 (9%) | 23415 (9%) | 63122 (9%) | |
70+ Yrs | 1840 (8%) | 21387 (8%) | 59907 (9%) | |
Median HH Income | $74,535 | $69,980 | $72,450 | |
Total Household Income | < 24K | 841 (14%) | 11276 (15%) | 28933 (15%) |
25-49K | 1063 (17%) | 14670 (20%) | 35167 (18%) | |
50-74K | 1074 (18%) | 13174 (18%) | 32121 (17%) | |
75-99K | 956 (16%) | 10545 (14%) | 25831 (13%) | |
100-199K | 1722 (29%) | 18620 (25%) | 48818 (26%) | |
200K+ | 263 (4%) | 4833 (6%) | 15105 (8%) | |
Highest Education Level | No Diploma | 2957 | 30683 | 77643 |
Diploma or GED | 3653 | 38633 | 96041 | |
Some College | 3430 | 36911 | 90572 | |
Assoc. Degree | 1165 | 13754 | 34393 | |
Bachelors Degree | 2593 | 35586 | 90559 | |
Higher Degree | 711 | 12405 | 38040 | |
Total Housing Units | 6,095 | 76,183 | 193,513 | |
--Owner-Occupied | 3,405 | 35,498 | 102,380 | |
--Renter-Occupied | 2,515 | 37,620 | 83,595 | |
Owner-Occupied Values | < 100K | 138 | 1621 | 4763 |
100-199K | 58 | 388 | 1323 | |
200-299K | 101 | 1009 | 3875 | |
300-399K | 422 | 4191 | 11334 | |
400-499K | 1188 | 8220 | 21276 | |
500K+ | 1498 | 20068 | 59809 | |
Total Working Age Population | 17,097 | 201,478 | 510,151 | |
In Work Force | 11,493 | 130,446 | 323,474 | |
Not In Work Force | 5,604 | 71,031 | 186,677 | |
Workforce Employed | 11,004 | 123,199 | 304,050 | |
Workforce Unemployed | 489 | 7,199 | 19,250 | |
Civlian Workforce | 11,493 | 130,398 | 323,300 | |
Military Workforce | 0 | 48 | 174 | |
Total Households | 5,920 | 73,117 | 185,975 | |
Family Households | 4,993 | 57,525 | 145,434 | |
Non-Family Households | 927 | 15,593 | 40,541 | |
Married Couple | 3,514 | 40,357 | 103,971 | |
Other Family | 1,479 | 17,167 | 41,463 | |
Married w/Child | 1,485 | 18,632 | 46,309 | |
Single Male w/Child | 193 | 1,918 | 4,457 | |
Single Female w/Child | 450 | 5,662 | 12,443 |
Population Change Last Two Decades - Plus Projection
2000 | % | 2010 | % | 2020 | % | 2030 | |
---|---|---|---|---|---|---|---|
California | 33,871,648 | +10 | 37,253,956 | +9 | 40,467,295 | +8 | 43,631,295 |
Los Angeles County | 9,519,338 | +3 | 9,818,605 | +6 | 10,369,367 | +4 | 10,759,850 |
Orange County | 2,846,289 | +6 | 3,010,232 | +8 | 3,257,087 | +5 | 3,431,096 |
Total Working Age Population:
Total Households:
Total Working Age Population:
Total Households:
Total Working Age Population:
Total Households: