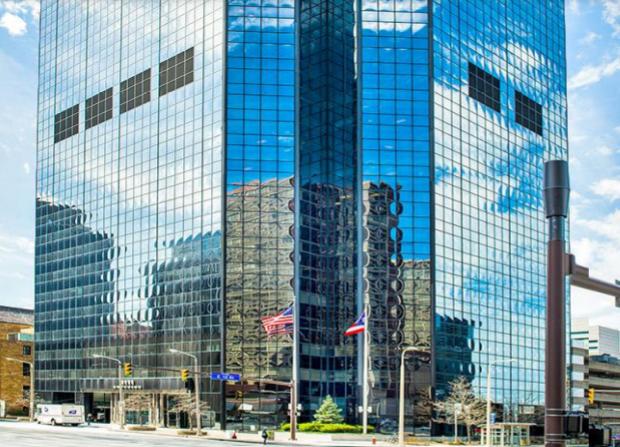
The 28-story and 350’ tall Class-A office building
known as 1111 Superior was built by Skidmore,
Owings & Merrill/Hatfield in 1984. The property’s
efficient floor plates, superior amenities and prime
views of Lake Erie presents an excellent and rare
opportunity for Cleveland’s prestigious companies.
1111 Superior stands above it’s competition in the
market, the building is one of the few office buildings
in Downtown Cleveland focusing on sustainability and
energy efficiency. 1111 Superior was awarded the LEED
silver certfication in 2017 and is rated one of the most
energy efficient buildings by energy star.
No part of this information may be copied, reproduced, repurposed, or screen-captured for any commercial purpose without prior written authorization from MyEListing.
While we strive to provide the most accurate information, all listing information, and demographic data, is provided by third-parties. As such, MyEListing will not be responsible for the accuracy of the information. It is strongly recommended that you verify all information with the listing agent, and any relevant agencies, prior to making any decisions.
What is the building size of this commercial Office property?
The size of this lease property at '.1111 Superior Avenue.' is 91146 square feet
What kind of Office is the propery at 1111 Superior Avenue?
The property at 1111 Superior Avenue Cleveland, OH 44114 is listed as a Professional Office property
What is the population within 1 mile of 1111 Superior Avenue in Cleveland?
The population within 1 mile of 1111 Superior Avenue Cleveland, OH 44114 is 10,932 people.
Who do I contact for questions about 1111 Superior Avenue?
You should contact the listing agent,
Myrna Previte, for any details regarding this commercial listing.