THE PROPERTY
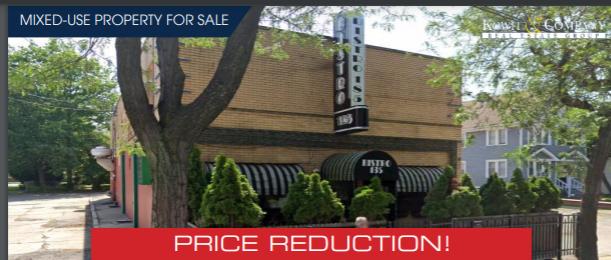
Mixed-use property for sale
Excellent Investment/owner user opportunity
Turn-key restaurant on the first floor with approximately 80
seats inside and approximately 20 seats on the patio
The second level has a large three bedroom apartment and a
one bedroom efficiency apartment
Property includes a rooftop patio, full basement and private parking
Major nearby tenants include Muldoon’s Saloon, The Standard and
Cleveland Clinic and just off I-90
No part of this information may be copied, reproduced, repurposed, or screen-captured for any commercial purpose without prior written authorization from MyEListing.
While we strive to provide the most accurate information, all listing information, and demographic data, is provided by third-parties. As such, MyEListing will not be responsible for the accuracy of the information. It is strongly recommended that you verify all information with the listing agent, and any relevant agencies, prior to making any decisions.
What is the building size of this Retail property in Cleveland, OH?
The size of the building/unit at 991 East 185th Street in Cleveland is 3,000 square feet
What kind of Retail is the propery at 991 East 185th Street?
The property at 991 East 185th Street Cleveland, OH 44119 is listed as a Food Service Retail property
What is the population within 1 mile of 991 East 185th Street in Cleveland?
The population within 1 mile of 991 East 185th Street Cleveland, OH 44119 is 14,140 people.
Who do I contact for questions about 991 East 185th Street?
You should contact the listing agent,
Amy Doroba-Kleinman, for any details regarding this commercial listing.