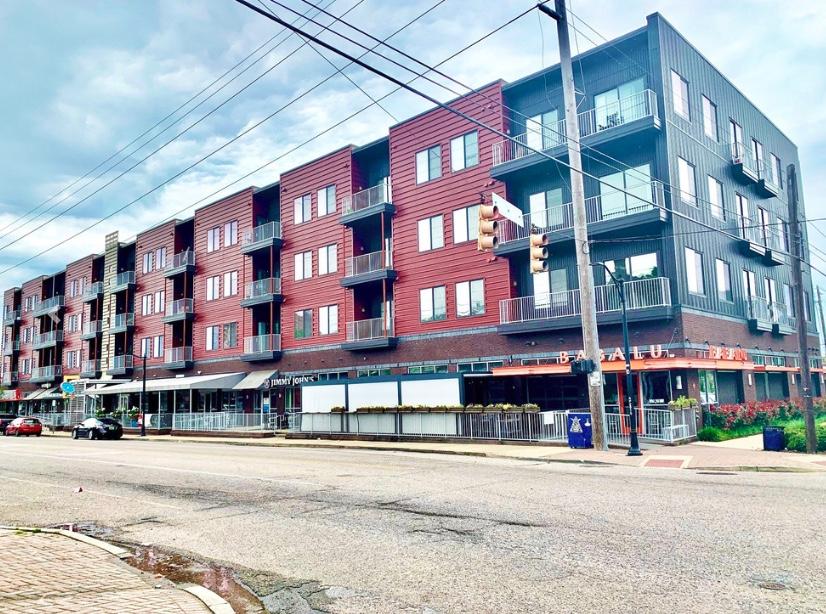
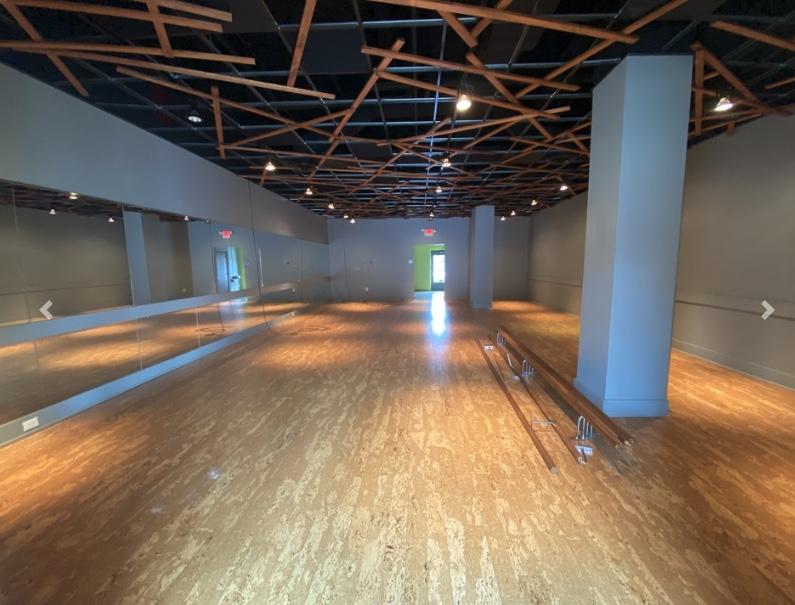
1-Mile | 3-Miles | 5-Miles | ||
---|---|---|---|---|
Total Population | 11,443 | 75,084 | 169,289 | |
Population Median Age | 37 | 38 | 38 | |
Population by Age | 0-9 Yrs | 960 (8%) | 8046 (10%) | 20500 (12%) |
10-19 Yrs | 975 (8%) | 8521 (11%) | 20427 (12%) | |
20-29 Yrs | 3385 (29%) | 14994 (19%) | 29978 (17%) | |
30-39 Yrs | 1705 (14%) | 11371 (15%) | 23646 (13%) | |
40-49 Yrs | 1180 (10%) | 8494 (11%) | 19281 (11%) | |
50-59 Yrs | 1127 (9%) | 9351 (12%) | 20671 (12%) | |
60-69 Yrs | 1015 (8%) | 7613 (10%) | 18442 (10%) | |
70+ Yrs | 1096 (9%) | 6692 (8%) | 16343 (9%) | |
Median HH Income | $42,966 | $45,947 | $44,230 | |
Total Household Income | < 24K | 1972 (33%) | 10973 (32%) | 23154 (32%) |
25-49K | 1249 (21%) | 6490 (19%) | 15269 (21%) | |
50-74K | 894 (15%) | 4484 (13%) | 10142 (14%) | |
75-99K | 519 (8%) | 2989 (8%) | 6484 (9%) | |
100-199K | 744 (12%) | 5180 (15%) | 10492 (14%) | |
200K+ | 453 (7%) | 3173 (9%) | 5879 (8%) | |
Highest Education Level | No Diploma | 453 | 5177 | 12420 |
Diploma or GED | 1210 | 9601 | 24669 | |
Some College | 1534 | 8826 | 22005 | |
Assoc. Degree | 403 | 2748 | 6808 | |
Bachelors Degree | 2246 | 14352 | 27183 | |
Higher Degree | 2108 | 11044 | 21129 | |
Total Housing Units | 7,275 | 41,704 | 88,996 | |
--Owner-Occupied | 1,620 | 14,550 | 35,422 | |
--Renter-Occupied | 4,211 | 18,741 | 35,998 | |
Owner-Occupied Values | < 100K | 161 | 3040 | 10918 |
100-199K | 361 | 2567 | 6035 | |
200-299K | 298 | 2394 | 5017 | |
300-399K | 226 | 1644 | 3933 | |
400-499K | 126 | 1138 | 2665 | |
500K+ | 447 | 3766 | 6854 | |
Total Working Age Population | 10,282 | 62,990 | 138,538 | |
In Work Force | 6,849 | 39,349 | 84,397 | |
Not In Work Force | 3,433 | 23,642 | 54,141 | |
Workforce Employed | 6,415 | 36,598 | 77,668 | |
Workforce Unemployed | 434 | 2,724 | 6,666 | |
Civlian Workforce | 6,849 | 39,322 | 84,334 | |
Military Workforce | 0 | 27 | 63 | |
Total Households | 5,831 | 33,291 | 71,421 | |
Family Households | 1,899 | 15,729 | 37,578 | |
Non-Family Households | 3,932 | 17,562 | 33,843 | |
Married Couple | 1,267 | 9,859 | 22,397 | |
Other Family | 632 | 5,870 | 15,181 | |
Married w/Child | 227 | 3,522 | 8,120 | |
Single Male w/Child | 8 | 514 | 1,049 | |
Single Female w/Child | 384 | 2,408 | 6,294 |
Population Change Last Two Decades - Plus Projection
2000 | % | 2010 | % | 2020 | % | 2030 | |
---|---|---|---|---|---|---|---|
Alabama | 4,447,100 | +7 | 4,779,736 | +3 | 4,940,253 | +4 | 5,124,380 |
Jefferson County | 662,047 | -1 | 658,466 | +1 | 662,458 | 0 | 665,244 |
Total Working Age Population:
Total Households:
Total Working Age Population:
Total Households:
Total Working Age Population:
Total Households: