Flex-Office-Warehouse
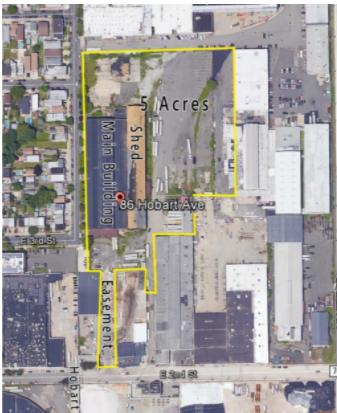
86 Hobart Avenue Bayonne, NJ 07002
86 Hobart Avenue Bayonne, NJ 07002
Details & Description
Listing Agents

Leo Esses
O: 732-287-3777
M: 917-902-6400
lesses@bussel.com
O: 732-287-3777
M: 917-902-6400
lesses@bussel.com
While we strive to provide the most accurate information, all listing information, and demographic data, is provided by third-parties. As such, MyEListing will not be responsible for the accuracy of the information. It is strongly recommended that you verify all information with the listing agent, and any relevant agencies, prior to making any decisions.