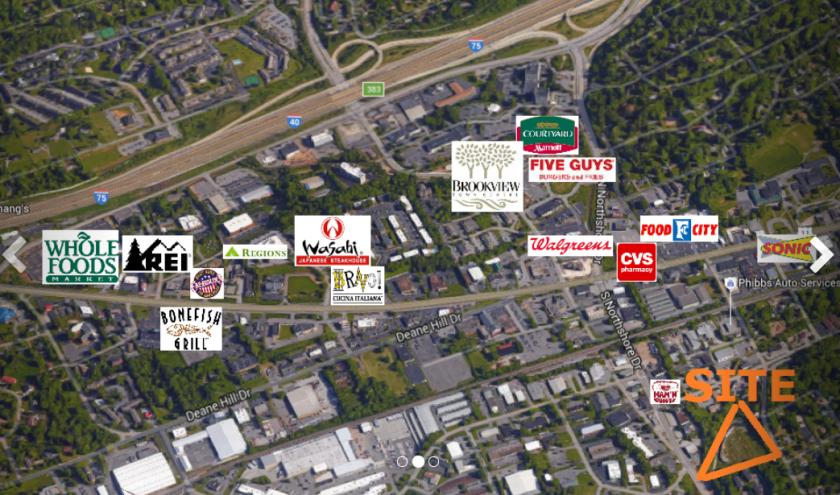
1-Mile | 3-Miles | 5-Miles | ||
---|---|---|---|---|
Total Population | 3,849 | 41,093 | 137,531 | |
Population Median Age | 42 | 39 | 36 | |
Population by Age | 0-9 Yrs | 309 (8%) | 4335 (10%) | 15617 (11%) |
10-19 Yrs | 394 (10%) | 3818 (9%) | 17692 (12%) | |
20-29 Yrs | 566 (14%) | 8394 (20%) | 31061 (22%) | |
30-39 Yrs | 541 (14%) | 5899 (14%) | 18079 (13%) | |
40-49 Yrs | 550 (14%) | 4860 (11%) | 14855 (10%) | |
50-59 Yrs | 551 (14%) | 4583 (11%) | 15432 (11%) | |
60-69 Yrs | 461 (11%) | 4923 (11%) | 12827 (9%) | |
70+ Yrs | 478 (12%) | 4282 (10%) | 11968 (8%) | |
Median HH Income | $71,326 | $52,456 | $49,264 | |
Total Household Income | < 24K | 341 (19%) | 4349 (23%) | 14597 (26%) |
25-49K | 346 (19%) | 4738 (25%) | 13795 (24%) | |
50-74K | 229 (12%) | 3060 (16%) | 9334 (16%) | |
75-99K | 131 (7%) | 1845 (9%) | 6438 (11%) | |
100-199K | 411 (23%) | 3154 (16%) | 8687 (15%) | |
200K+ | 304 (17%) | 1733 (9%) | 3267 (5%) | |
Highest Education Level | No Diploma | 102 | 1945 | 7025 |
Diploma or GED | 384 | 4903 | 18840 | |
Some College | 323 | 4418 | 15969 | |
Assoc. Degree | 183 | 1712 | 6462 | |
Bachelors Degree | 999 | 8570 | 21274 | |
Higher Degree | 851 | 6885 | 15362 | |
Total Housing Units | 1,944 | 20,693 | 62,093 | |
--Owner-Occupied | 1,077 | 9,299 | 28,435 | |
--Renter-Occupied | 685 | 9,579 | 27,684 | |
Owner-Occupied Values | < 100K | 68 | 792 | 4949 |
100-199K | 164 | 3404 | 11789 | |
200-299K | 236 | 1784 | 5884 | |
300-399K | 179 | 898 | 2049 | |
400-499K | 182 | 924 | 1246 | |
500K+ | 247 | 1497 | 2519 | |
Total Working Age Population | 3,264 | 34,463 | 113,651 | |
In Work Force | 2,126 | 22,979 | 73,846 | |
Not In Work Force | 1,138 | 11,485 | 39,805 | |
Workforce Employed | 2,079 | 22,234 | 70,482 | |
Workforce Unemployed | 47 | 730 | 3,285 | |
Civlian Workforce | 2,126 | 22,964 | 73,768 | |
Military Workforce | 0 | 15 | 79 | |
Total Households | 1,762 | 18,878 | 56,119 | |
Family Households | 984 | 9,502 | 30,324 | |
Non-Family Households | 778 | 9,376 | 25,795 | |
Married Couple | 841 | 7,406 | 21,772 | |
Other Family | 143 | 2,096 | 8,552 | |
Married w/Child | 286 | 2,757 | 8,213 | |
Single Male w/Child | 26 | 218 | 794 | |
Single Female w/Child | 60 | 982 | 3,770 |
Population Change Last Two Decades - Plus Projection
2000 | % | 2010 | % | 2020 | % | 2030 | |
---|---|---|---|---|---|---|---|
Tennessee | 5,689,283 | +12 | 6,346,105 | +9 | 6,886,369 | +7 | 7,393,069 |
Knox County | 382,032 | +13 | 432,226 | +10 | 473,996 | +8 | 513,318 |
Blount County | 105,823 | +16 | 123,010 | +9 | 133,808 | +8 | 143,918 |
Total Working Age Population:
Total Households:
Total Working Age Population:
Total Households:
Total Working Age Population:
Total Households: