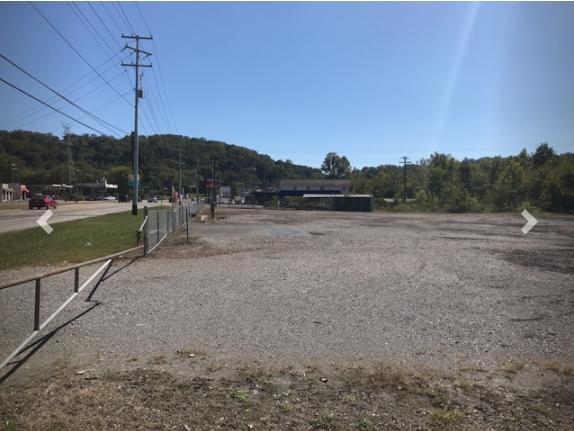
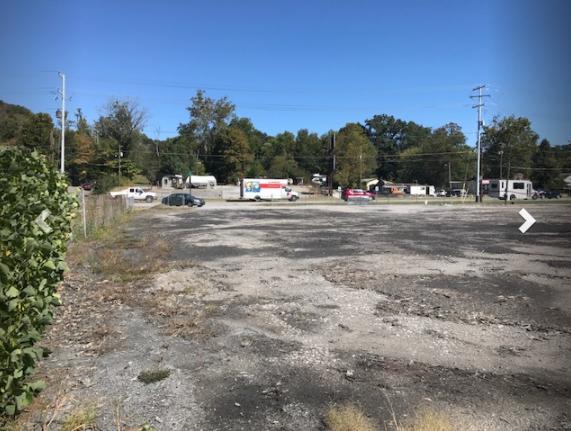
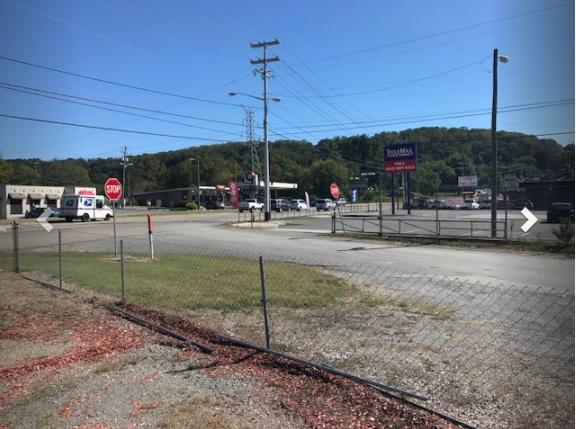
1-Mile | 3-Miles | 5-Miles | ||
---|---|---|---|---|
Total Population | 5,480 | 39,539 | 96,365 | |
Population Median Age | 37 | 40 | 39 | |
Population by Age | 0-9 Yrs | 814 (14%) | 4803 (12%) | 11843 (12%) |
10-19 Yrs | 759 (13%) | 4667 (11%) | 11254 (11%) | |
20-29 Yrs | 613 (11%) | 4957 (12%) | 13519 (14%) | |
30-39 Yrs | 894 (16%) | 5269 (13%) | 13280 (13%) | |
40-49 Yrs | 746 (13%) | 5333 (13%) | 12717 (13%) | |
50-59 Yrs | 578 (10%) | 4908 (12%) | 11944 (12%) | |
60-69 Yrs | 478 (8%) | 4774 (12%) | 11082 (11%) | |
70+ Yrs | 597 (10%) | 4829 (12%) | 10727 (11%) | |
Median HH Income | $49,415 | $56,226 | $48,014 | |
Total Household Income | < 24K | 502 (23%) | 2766 (17%) | 9264 (23%) |
25-49K | 593 (27%) | 4225 (26%) | 11235 (28%) | |
50-74K | 496 (22%) | 3343 (21%) | 7794 (19%) | |
75-99K | 269 (12%) | 2169 (13%) | 4551 (11%) | |
100-199K | 251 (11%) | 2715 (17%) | 5728 (14%) | |
200K+ | 53 (2%) | 574 (3%) | 961 (2%) | |
Highest Education Level | No Diploma | 411 | 2749 | 7322 |
Diploma or GED | 1286 | 8265 | 20942 | |
Some College | 848 | 6458 | 15566 | |
Assoc. Degree | 310 | 2544 | 5886 | |
Bachelors Degree | 449 | 4776 | 10696 | |
Higher Degree | 217 | 2696 | 5918 | |
Total Housing Units | 2,345 | 17,037 | 43,410 | |
--Owner-Occupied | 1,431 | 11,381 | 26,367 | |
--Renter-Occupied | 734 | 4,411 | 13,166 | |
Owner-Occupied Values | < 100K | 451 | 2160 | 6538 |
100-199K | 713 | 5759 | 13186 | |
200-299K | 179 | 2294 | 4561 | |
300-399K | 58 | 744 | 1262 | |
400-499K | 12 | 146 | 317 | |
500K+ | 18 | 278 | 503 | |
Total Working Age Population | 4,234 | 31,929 | 77,752 | |
In Work Force | 2,708 | 20,118 | 49,021 | |
Not In Work Force | 1,525 | 11,811 | 28,731 | |
Workforce Employed | 2,575 | 19,143 | 46,734 | |
Workforce Unemployed | 133 | 972 | 2,271 | |
Civlian Workforce | 2,708 | 20,115 | 49,005 | |
Military Workforce | 0 | 3 | 16 | |
Total Households | 2,165 | 15,792 | 39,533 | |
Family Households | 1,431 | 10,544 | 24,537 | |
Non-Family Households | 734 | 5,248 | 14,996 | |
Married Couple | 1,064 | 8,151 | 18,041 | |
Other Family | 366 | 2,394 | 6,496 | |
Married w/Child | 498 | 3,204 | 6,765 | |
Single Male w/Child | 76 | 433 | 1,000 | |
Single Female w/Child | 119 | 782 | 2,481 |
Population Change Last Two Decades - Plus Projection
2000 | % | 2010 | % | 2020 | % | 2030 | |
---|---|---|---|---|---|---|---|
Tennessee | 5,689,283 | +12 | 6,346,105 | +9 | 6,886,369 | +7 | 7,393,069 |
Knox County | 382,032 | +13 | 432,226 | +10 | 473,996 | +8 | 513,318 |
Total Working Age Population:
Total Households:
Total Working Age Population:
Total Households:
Total Working Age Population:
Total Households: