FEATURES
? 1,005 SF Available
? Perfect for a donut shop, pizza, insurance,
mobile phone, dry cleaner, coffee shop or
service related users.
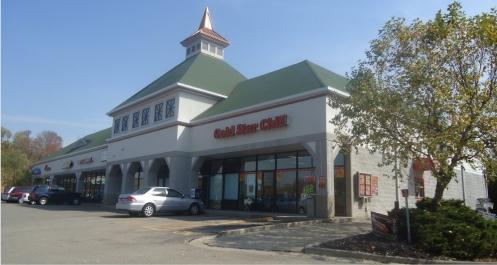
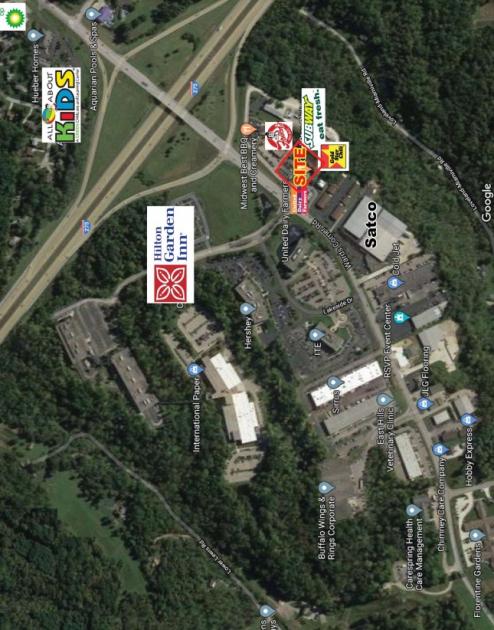
? Convenient traffic light access into this
modern convenience center at UDF,
Frisch’s and Midwest BBQ.
? Growing residential and office population
? Florentine Garden’s Nursing home close to
center.
? Quoted rate: $14.00 PSF NNN ($4.50)
No part of this information may be copied, reproduced, repurposed, or screen-captured for any commercial purpose without prior written authorization from MyEListing.
While we strive to provide the most accurate information, all listing information, and demographic data, is provided by third-parties. As such, MyEListing will not be responsible for the accuracy of the information. It is strongly recommended that you verify all information with the listing agent, and any relevant agencies, prior to making any decisions.
What is the asking price for 471 Wards Corner Road in Loveland?
The asking price for 471 Wards Corner Road is $14.00 a SF per Year
What is the building size of this commercial Retail property?
The size of this lease property at '.471 Wards Corner Road.' is 1005 square feet
What kind of Retail is the propery at 471 Wards Corner Road?
The property at 471 Wards Corner Road Loveland, OH 45140 is listed as a Shopping Center Retail property
What is the population within 1 mile of 471 Wards Corner Road in Loveland?
The population within 1 mile of 471 Wards Corner Road Loveland, OH 45140 is 2,601 people.
Who do I contact for questions about 471 Wards Corner Road?
You should contact the listing agent,
Karen Duesing, for any details regarding this commercial listing.