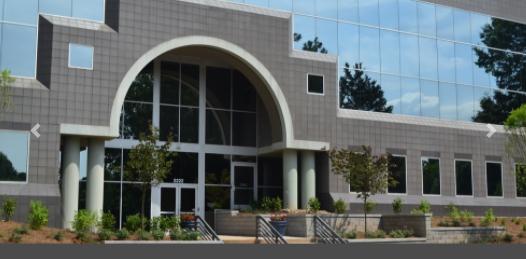
1-Mile | 3-Miles | 5-Miles | ||
---|---|---|---|---|
Total Population | 4,772 | 41,467 | 114,311 | |
Population Median Age | 34 | 36 | 36 | |
Population by Age | 0-9 Yrs | 661 (13%) | 5440 (13%) | 16190 (14%) |
10-19 Yrs | 418 (8%) | 4504 (10%) | 12401 (10%) | |
20-29 Yrs | 1029 (21%) | 6289 (15%) | 16861 (14%) | |
30-39 Yrs | 988 (20%) | 8487 (20%) | 22689 (19%) | |
40-49 Yrs | 649 (13%) | 6113 (14%) | 16763 (14%) | |
50-59 Yrs | 381 (7%) | 4461 (10%) | 12142 (10%) | |
60-69 Yrs | 407 (8%) | 3898 (9%) | 10891 (9%) | |
70+ Yrs | 240 (5%) | 2276 (5%) | 6374 (5%) | |
Median HH Income | $56,283 | $75,257 | $76,652 | |
Total Household Income | < 24K | 448 (21%) | 2324 (13%) | 5895 (12%) |
25-49K | 488 (23%) | 3131 (17%) | 8878 (18%) | |
50-74K | 353 (16%) | 3377 (19%) | 8697 (18%) | |
75-99K | 374 (17%) | 2722 (15%) | 6954 (14%) | |
100-199K | 382 (18%) | 4883 (27%) | 13136 (27%) | |
200K+ | 45 (2%) | 1283 (7%) | 4299 (8%) | |
Highest Education Level | No Diploma | 310 | 1791 | 4369 |
Diploma or GED | 420 | 2996 | 8875 | |
Some College | 621 | 4628 | 12416 | |
Assoc. Degree | 289 | 2239 | 5183 | |
Bachelors Degree | 975 | 9905 | 26823 | |
Higher Degree | 728 | 7916 | 22081 | |
Total Housing Units | 2,172 | 18,671 | 51,176 | |
--Owner-Occupied | 689 | 9,147 | 25,381 | |
--Renter-Occupied | 1,401 | 8,572 | 22,478 | |
Owner-Occupied Values | < 100K | 31 | 218 | 1185 |
100-199K | 269 | 3114 | 7635 | |
200-299K | 365 | 3829 | 8694 | |
300-399K | 19 | 1230 | 4090 | |
400-499K | 0 | 448 | 1868 | |
500K+ | 5 | 307 | 1908 | |
Total Working Age Population | 3,816 | 33,066 | 90,349 | |
In Work Force | 3,065 | 25,604 | 68,684 | |
Not In Work Force | 751 | 7,463 | 21,665 | |
Workforce Employed | 2,925 | 24,464 | 65,490 | |
Workforce Unemployed | 140 | 1,082 | 3,080 | |
Civlian Workforce | 3,065 | 25,546 | 68,570 | |
Military Workforce | 0 | 57 | 114 | |
Total Households | 2,090 | 17,719 | 47,859 | |
Family Households | 924 | 10,344 | 28,803 | |
Non-Family Households | 1,166 | 7,374 | 19,056 | |
Married Couple | 519 | 7,479 | 20,854 | |
Other Family | 405 | 2,866 | 7,949 | |
Married w/Child | 207 | 3,120 | 9,643 | |
Single Male w/Child | 60 | 475 | 1,047 | |
Single Female w/Child | 217 | 1,366 | 3,602 |
Population Change Last Two Decades - Plus Projection
2000 | % | 2010 | % | 2020 | % | 2030 | |
---|---|---|---|---|---|---|---|
North Carolina | 8,049,313 | +18 | 9,535,483 | +12 | 10,647,005 | +11 | 11,847,719 |
Chatham County | 49,329 | +29 | 63,505 | +23 | 78,040 | +23 | 95,788 |
Wake County | 627,846 | +44 | 900,993 | +24 | 1,119,165 | +21 | 1,351,791 |
Durham County | 223,314 | +20 | 267,587 | +20 | 320,933 | +14 | 367,357 |
Total Working Age Population:
Total Households:
Total Working Age Population:
Total Households:
Total Working Age Population:
Total Households: