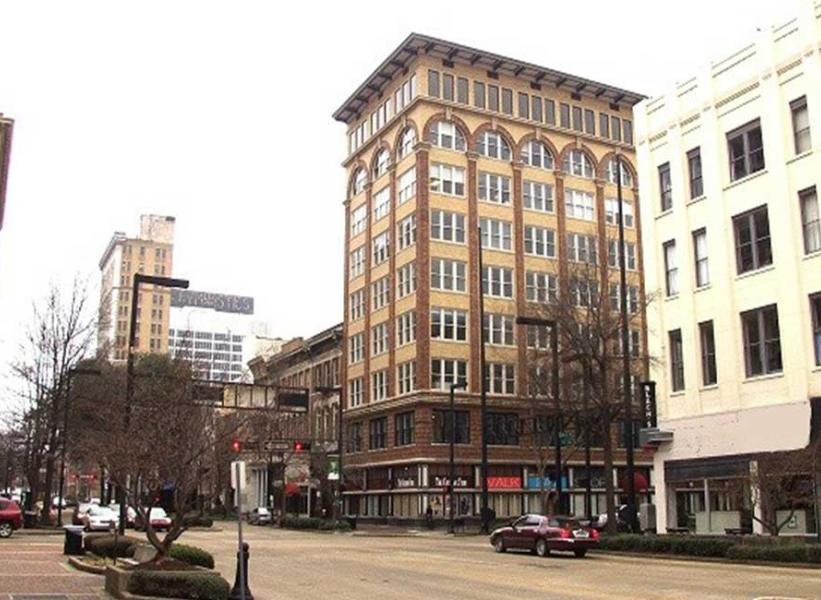
Office Space
1929 3rd Avenue North Birmingham, AL 35203
1929 3rd Avenue North Birmingham, AL 35203
Details & Description
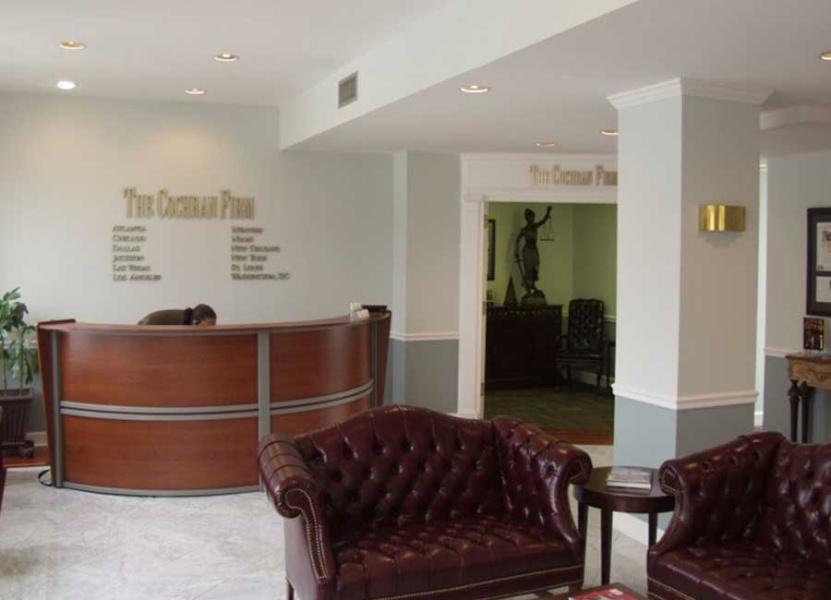
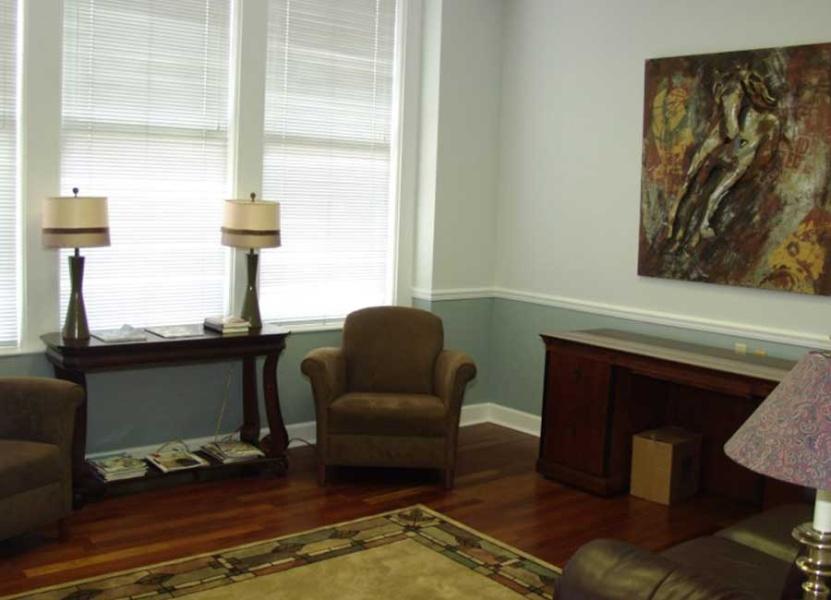
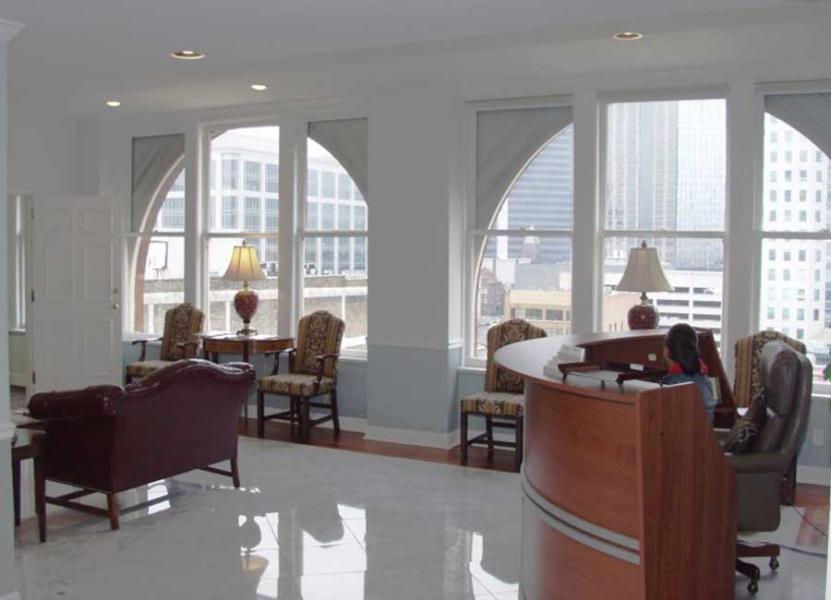
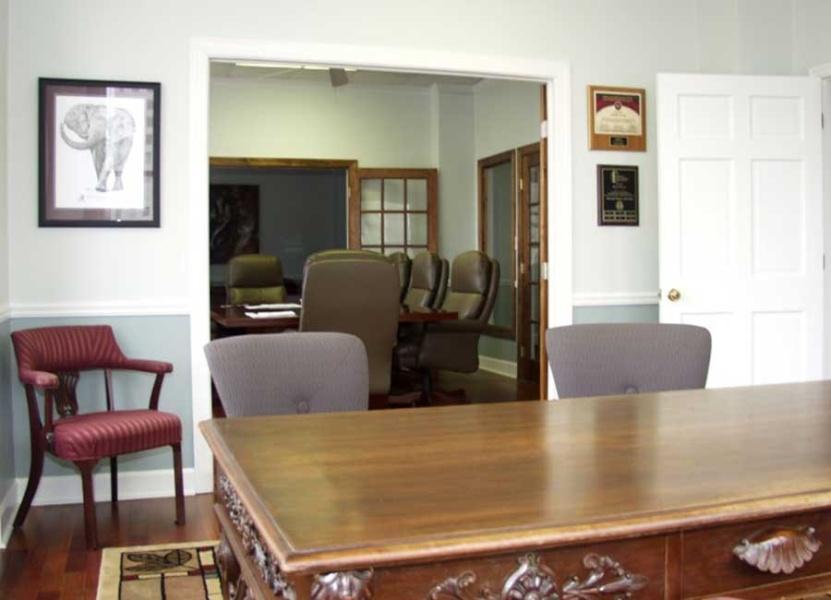
Property Highlights
• Amenities include: dual elevators, newly remodeled Lobby and large Conference Room for tenants!
• Close to University of Alabama-Birmingham, UAB & St. Vincent’s Hospitals and airport
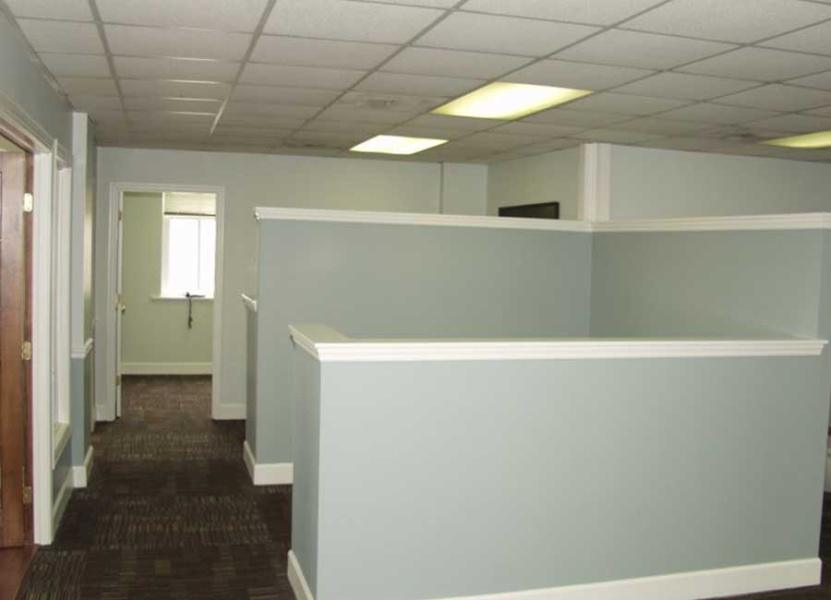
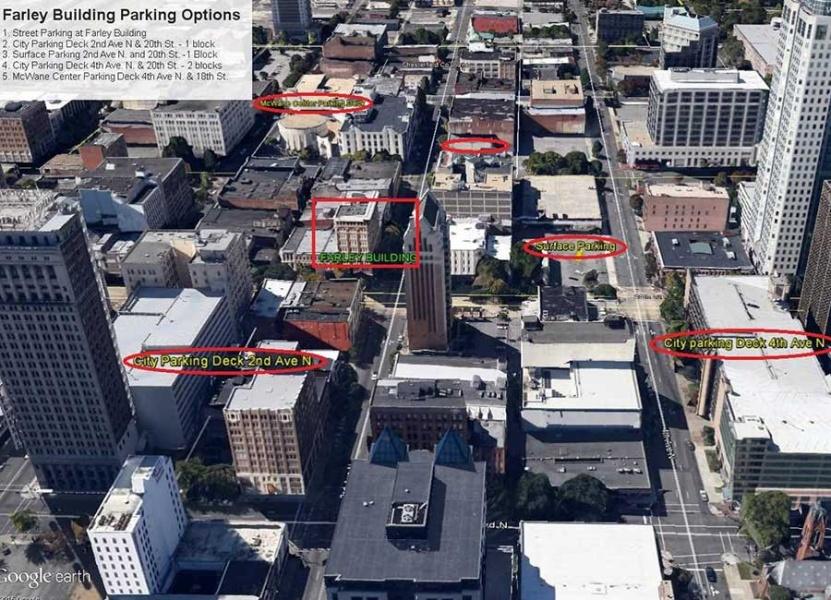
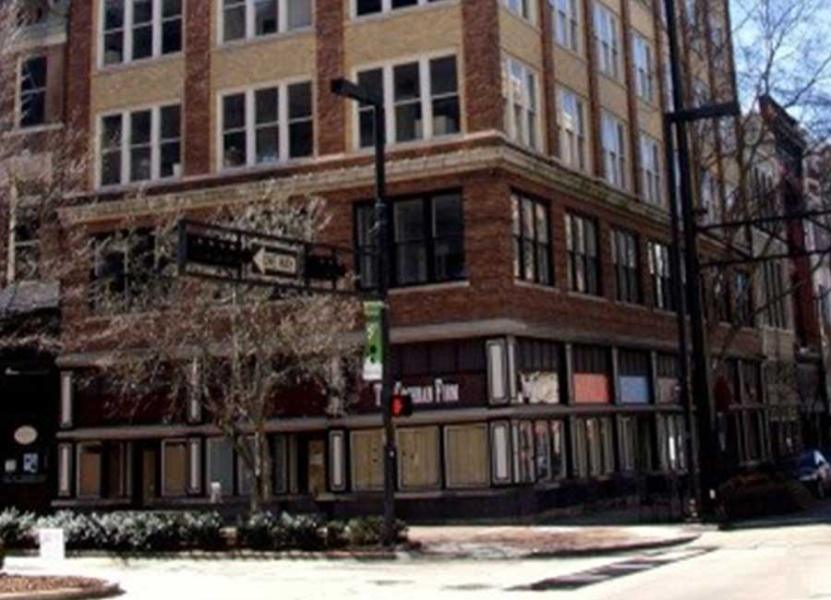
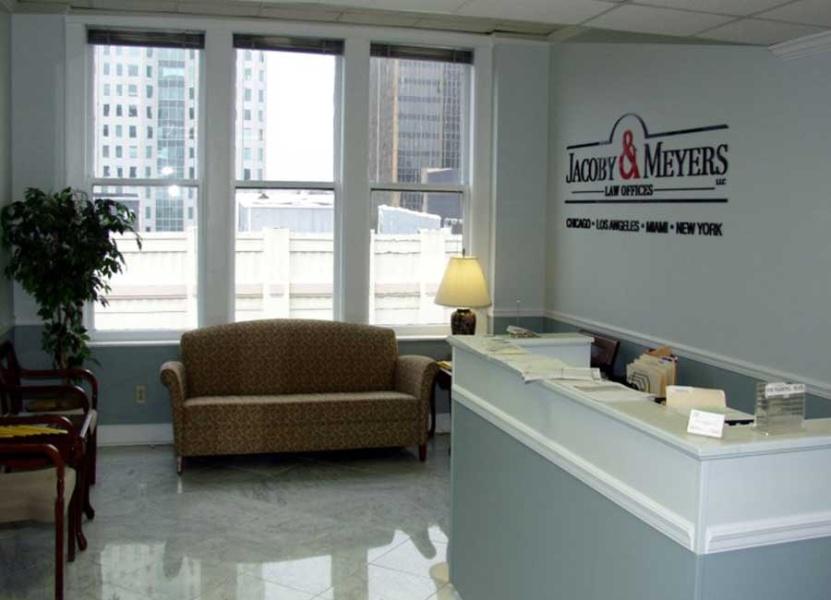
Additional Photos
Listing Agents

Daniel Goff
O: 205-970-6543
dgoff@lahcommercial.com
O: 205-970-6543
dgoff@lahcommercial.com
While we strive to provide the most accurate information, all listing information, and demographic data, is provided by third-parties. As such, MyEListing will not be responsible for the accuracy of the information. It is strongly recommended that you verify all information with the listing agent, and any relevant agencies, prior to making any decisions.