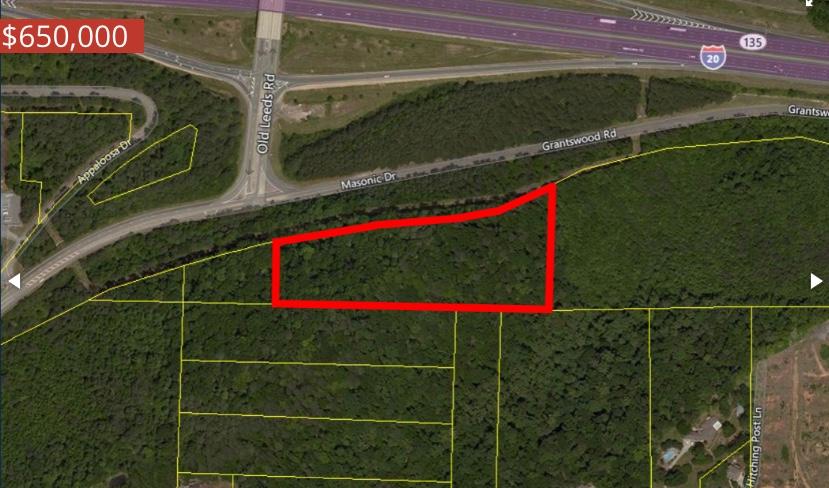
1-Mile | 3-Miles | 5-Miles | ||
---|---|---|---|---|
Total Population | 1,301 | 12,428 | 69,913 | |
Population Median Age | 42 | 41 | 39 | |
Population by Age | 0-9 Yrs | 124 (9%) | 1414 (11%) | 9299 (13%) |
10-19 Yrs | 167 (12%) | 1605 (12%) | 8980 (12%) | |
20-29 Yrs | 133 (10%) | 1226 (9%) | 8528 (12%) | |
30-39 Yrs | 228 (17%) | 1741 (14%) | 9488 (13%) | |
40-49 Yrs | 125 (9%) | 1493 (12%) | 8965 (12%) | |
50-59 Yrs | 152 (11%) | 1775 (14%) | 9588 (13%) | |
60-69 Yrs | 220 (16%) | 1802 (14%) | 7992 (11%) | |
70+ Yrs | 154 (11%) | 1372 (11%) | 7071 (10%) | |
Median HH Income | $49,735 | $56,778 | $52,203 | |
Total Household Income | < 24K | 108 (20%) | 1159 (22%) | 7136 (25%) |
25-49K | 155 (29%) | 1117 (21%) | 6133 (22%) | |
50-74K | 88 (16%) | 854 (16%) | 4615 (16%) | |
75-99K | 61 (11%) | 758 (14%) | 3333 (12%) | |
100-199K | 79 (15%) | 905 (17%) | 4587 (16%) | |
200K+ | 33 (6%) | 332 (6%) | 1681 (6%) | |
Highest Education Level | No Diploma | 139 | 964 | 5617 |
Diploma or GED | 274 | 2161 | 12762 | |
Some College | 166 | 1613 | 9747 | |
Assoc. Degree | 73 | 779 | 4178 | |
Bachelors Degree | 226 | 2066 | 9614 | |
Higher Degree | 77 | 1270 | 6296 | |
Total Housing Units | 552 | 5,632 | 31,878 | |
--Owner-Occupied | 401 | 3,946 | 18,020 | |
--Renter-Occupied | 124 | 1,179 | 9,467 | |
Owner-Occupied Values | < 100K | 83 | 1109 | 5641 |
100-199K | 175 | 1596 | 6243 | |
200-299K | 72 | 610 | 2693 | |
300-399K | 42 | 223 | 1119 | |
400-499K | 9 | 141 | 675 | |
500K+ | 19 | 267 | 1649 | |
Total Working Age Population | 1,060 | 9,987 | 54,926 | |
In Work Force | 659 | 6,148 | 34,375 | |
Not In Work Force | 401 | 3,839 | 20,551 | |
Workforce Employed | 643 | 5,864 | 31,897 | |
Workforce Unemployed | 16 | 279 | 2,449 | |
Civlian Workforce | 659 | 6,143 | 34,345 | |
Military Workforce | 0 | 5 | 29 | |
Total Households | 524 | 5,124 | 27,486 | |
Family Households | 301 | 3,106 | 17,064 | |
Non-Family Households | 224 | 2,019 | 10,423 | |
Married Couple | 240 | 2,196 | 10,943 | |
Other Family | 60 | 910 | 6,121 | |
Married w/Child | 50 | 663 | 4,033 | |
Single Male w/Child | 3 | 62 | 440 | |
Single Female w/Child | 46 | 490 | 2,867 |
Population Change Last Two Decades - Plus Projection
2000 | % | 2010 | % | 2020 | % | 2030 | |
---|---|---|---|---|---|---|---|
Alabama | 4,447,100 | +7 | 4,779,736 | +3 | 4,940,253 | +4 | 5,124,380 |
Jefferson County | 662,047 | -1 | 658,466 | +1 | 662,458 | 0 | 665,244 |
Total Working Age Population:
Total Households:
Total Working Age Population:
Total Households:
Total Working Age Population:
Total Households: