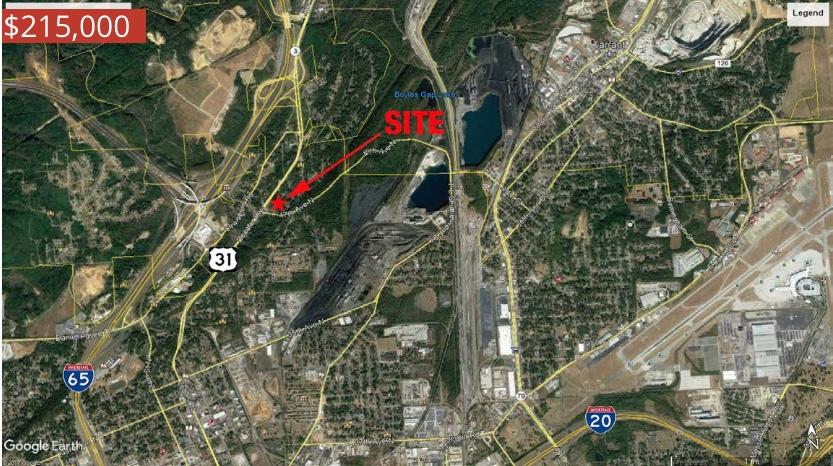
1-Mile | 3-Miles | 5-Miles | ||
---|---|---|---|---|
Total Population | 2,229 | 27,414 | 93,309 | |
Population Median Age | 35 | 39 | 39 | |
Population by Age | 0-9 Yrs | 447 (20%) | 3898 (14%) | 11387 (12%) |
10-19 Yrs | 311 (13%) | 2780 (10%) | 10554 (11%) | |
20-29 Yrs | 249 (11%) | 3561 (12%) | 15242 (16%) | |
30-39 Yrs | 298 (13%) | 4000 (14%) | 12748 (13%) | |
40-49 Yrs | 209 (9%) | 2716 (9%) | 10083 (10%) | |
50-59 Yrs | 212 (9%) | 3762 (13%) | 12488 (13%) | |
60-69 Yrs | 309 (13%) | 3877 (14%) | 11991 (12%) | |
70+ Yrs | 194 (8%) | 2821 (10%) | 8816 (9%) | |
Median HH Income | $27,384 | $30,561 | $36,234 | |
Total Household Income | < 24K | 391 (47%) | 4371 (41%) | 14277 (37%) |
25-49K | 207 (25%) | 3019 (28%) | 9376 (24%) | |
50-74K | 107 (12%) | 1477 (13%) | 5817 (15%) | |
75-99K | 57 (6%) | 848 (7%) | 3470 (9%) | |
100-199K | 58 (7%) | 786 (7%) | 4293 (11%) | |
200K+ | 6 (0%) | 136 (1%) | 891 (2%) | |
Highest Education Level | No Diploma | 296 | 3651 | 9872 |
Diploma or GED | 454 | 6502 | 19236 | |
Some College | 311 | 4705 | 14595 | |
Assoc. Degree | 135 | 1498 | 4857 | |
Bachelors Degree | 93 | 1831 | 9432 | |
Higher Degree | 51 | 792 | 5901 | |
Total Housing Units | 1,084 | 13,529 | 47,351 | |
--Owner-Occupied | 459 | 5,707 | 18,799 | |
--Renter-Occupied | 367 | 4,929 | 19,324 | |
Owner-Occupied Values | < 100K | 301 | 3770 | 9043 |
100-199K | 120 | 1288 | 5893 | |
200-299K | 35 | 568 | 2469 | |
300-399K | 2 | 40 | 608 | |
400-499K | 0 | 5 | 159 | |
500K+ | 2 | 37 | 628 | |
Total Working Age Population | 1,576 | 21,689 | 76,430 | |
In Work Force | 794 | 11,640 | 43,596 | |
Not In Work Force | 781 | 10,049 | 32,834 | |
Workforce Employed | 693 | 10,289 | 39,056 | |
Workforce Unemployed | 99 | 1,334 | 4,438 | |
Civlian Workforce | 793 | 11,624 | 43,495 | |
Military Workforce | 2 | 16 | 102 | |
Total Households | 827 | 10,636 | 38,123 | |
Family Households | 524 | 6,245 | 20,664 | |
Non-Family Households | 303 | 4,391 | 17,459 | |
Married Couple | 200 | 2,624 | 10,551 | |
Other Family | 324 | 3,621 | 10,114 | |
Married w/Child | 63 | 664 | 3,187 | |
Single Male w/Child | 19 | 233 | 599 | |
Single Female w/Child | 176 | 1,224 | 3,949 |
Population Change Last Two Decades - Plus Projection
2000 | % | 2010 | % | 2020 | % | 2030 | |
---|---|---|---|---|---|---|---|
Alabama | 4,447,100 | +7 | 4,779,736 | +3 | 4,940,253 | +4 | 5,124,380 |
Jefferson County | 662,047 | -1 | 658,466 | +1 | 662,458 | 0 | 665,244 |
Total Working Age Population:
Total Households:
Total Working Age Population:
Total Households:
Total Working Age Population:
Total Households: