Commercial Land
2451 Green Springs Highway Birmingham, AL 35209
2451 Green Springs Highway Birmingham, AL 35209
Details & Description
Property Highlights
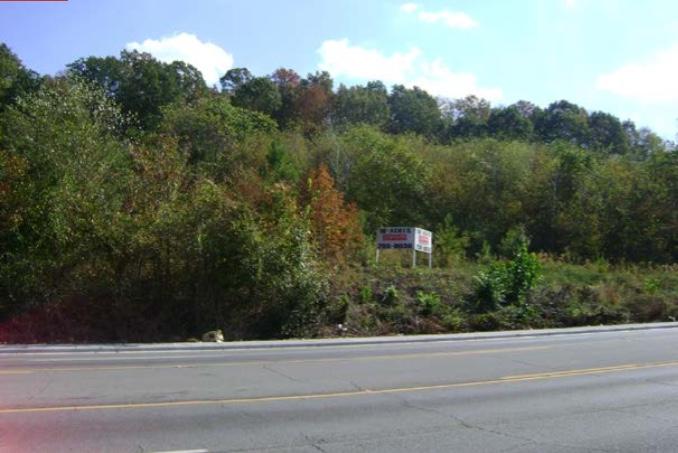
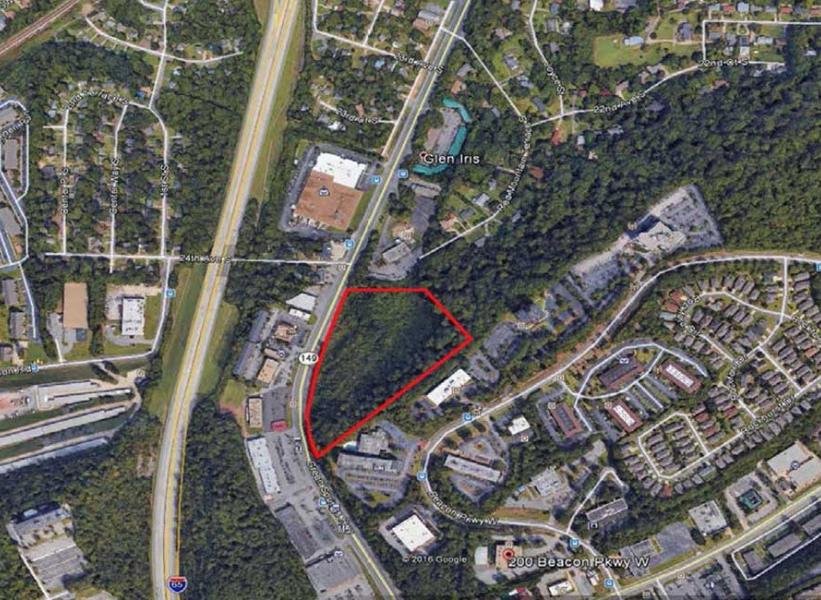
- • Great visibility on Green Springs Hwy
- • Terrific views of downtown
- • In very close proximity to I-65
- • Property abuts the Vulcan Trail
- • Traffic Count: 20,830 Vehicles Per Day
- • Zoned QB-2 City of Birmingham
Listing Agents

Bill Warren
O: 205-960-1787
bwarren@lahcommercial.com
O: 205-960-1787
bwarren@lahcommercial.com
While we strive to provide the most accurate information, all listing information, and demographic data, is provided by third-parties. As such, MyEListing will not be responsible for the accuracy of the information. It is strongly recommended that you verify all information with the listing agent, and any relevant agencies, prior to making any decisions.