Industrial Properties
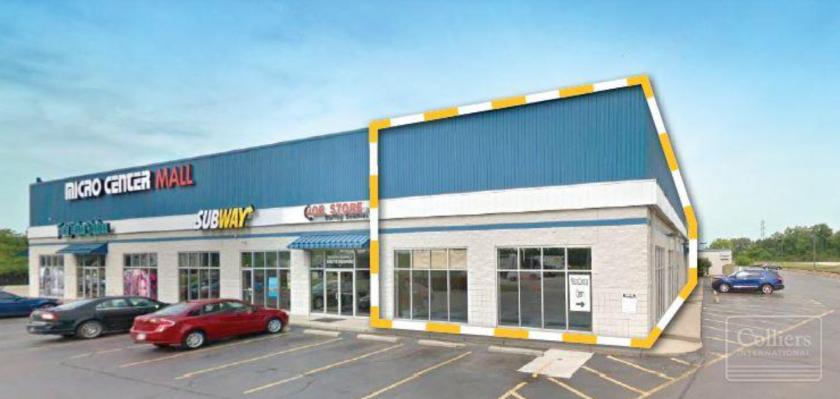
11755 Mosteller Road Sharonville, OH 45241
11755 Mosteller Road Sharonville, OH 45241
Details & Description
Listing Agents

Erin Casey
O: 513-562-2225
M: 513-312-7468
Erin.Casey@colliers.com
O: 513-562-2225
M: 513-312-7468
Erin.Casey@colliers.com

Drew Wall
O: 513-562-2254
M: 513-335-1728
drew.wall@colliers.com
O: 513-562-2254
M: 513-335-1728
drew.wall@colliers.com
While we strive to provide the most accurate information, all listing information, and demographic data, is provided by third-parties. As such, MyEListing will not be responsible for the accuracy of the information. It is strongly recommended that you verify all information with the listing agent, and any relevant agencies, prior to making any decisions.


