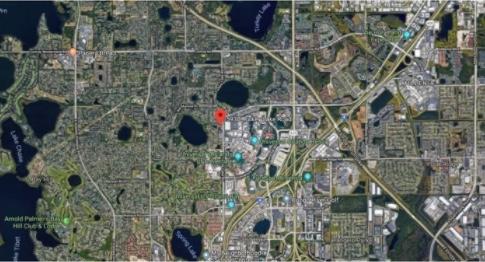
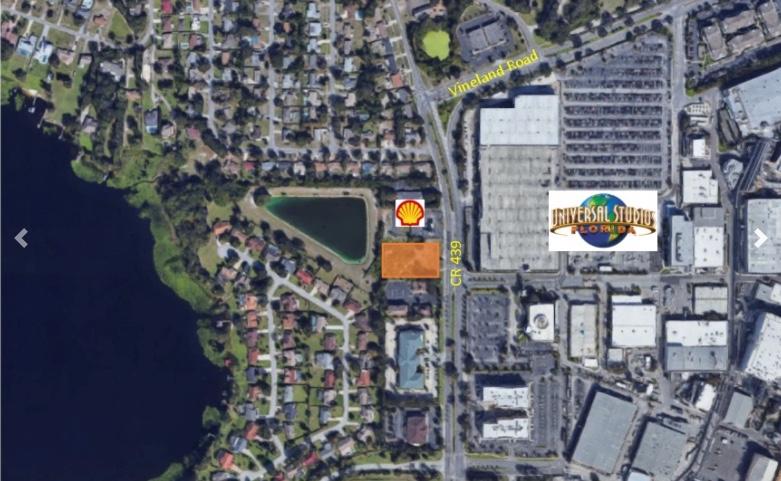
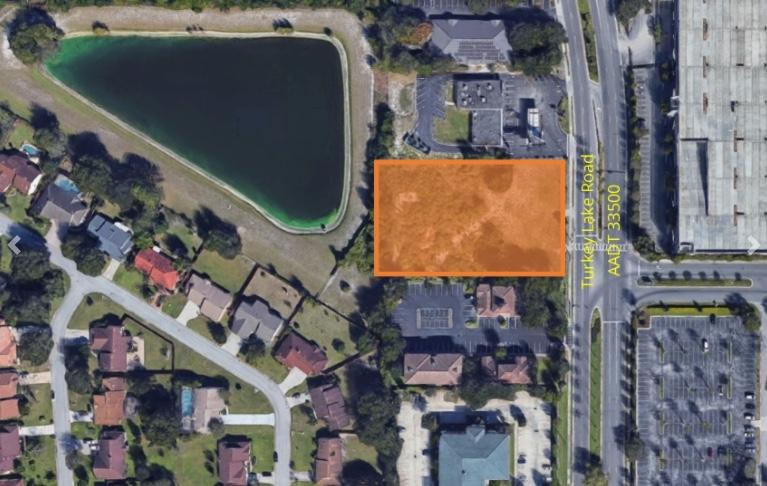
1-Mile | 3-Miles | 5-Miles | ||
---|---|---|---|---|
Total Population | 6,246 | 81,646 | 205,757 | |
Population Median Age | 39 | 36 | 35 | |
Population by Age | 0-9 Yrs | 725 (11%) | 10056 (12%) | 26066 (12%) |
10-19 Yrs | 626 (10%) | 8922 (10%) | 24059 (11%) | |
20-29 Yrs | 807 (12%) | 16421 (20%) | 39282 (19%) | |
30-39 Yrs | 1019 (16%) | 13215 (16%) | 33880 (16%) | |
40-49 Yrs | 788 (12%) | 10999 (13%) | 27356 (13%) | |
50-59 Yrs | 1013 (16%) | 10491 (12%) | 25917 (12%) | |
60-69 Yrs | 881 (14%) | 6862 (8%) | 16957 (8%) | |
70+ Yrs | 387 (6%) | 4681 (5%) | 12240 (5%) | |
Median HH Income | $63,720 | $53,515 | $48,493 | |
Total Household Income | < 24K | 416 (16%) | 6413 (20%) | 17715 (23%) |
25-49K | 583 (23%) | 7846 (25%) | 20347 (27%) | |
50-74K | 484 (19%) | 6428 (21%) | 14007 (18%) | |
75-99K | 234 (9%) | 3479 (11%) | 7579 (10%) | |
100-199K | 407 (16%) | 4248 (13%) | 9471 (12%) | |
200K+ | 381 (15%) | 2184 (7%) | 5170 (6%) | |
Highest Education Level | No Diploma | 243 | 4348 | 16401 |
Diploma or GED | 745 | 11242 | 32501 | |
Some College | 829 | 11461 | 27722 | |
Assoc. Degree | 389 | 6371 | 14824 | |
Bachelors Degree | 1809 | 15707 | 31832 | |
Higher Degree | 655 | 7054 | 15276 | |
Total Housing Units | 3,023 | 36,471 | 88,838 | |
--Owner-Occupied | 1,595 | 11,783 | 30,021 | |
--Renter-Occupied | 910 | 18,813 | 44,269 | |
Owner-Occupied Values | < 100K | 132 | 1616 | 5866 |
100-199K | 165 | 2272 | 6870 | |
200-299K | 495 | 2648 | 5060 | |
300-399K | 653 | 2354 | 4204 | |
400-499K | 91 | 874 | 2058 | |
500K+ | 60 | 2019 | 5963 | |
Total Working Age Population | 5,074 | 66,142 | 164,751 | |
In Work Force | 3,732 | 47,912 | 115,364 | |
Not In Work Force | 1,342 | 18,230 | 49,387 | |
Workforce Employed | 3,588 | 45,375 | 108,763 | |
Workforce Unemployed | 144 | 2,473 | 6,476 | |
Civlian Workforce | 3,732 | 47,848 | 115,239 | |
Military Workforce | 0 | 64 | 124 | |
Total Households | 2,505 | 30,597 | 74,290 | |
Family Households | 1,713 | 19,700 | 47,494 | |
Non-Family Households | 792 | 10,897 | 26,796 | |
Married Couple | 1,362 | 12,818 | 29,394 | |
Other Family | 351 | 6,882 | 18,099 | |
Married w/Child | 487 | 5,041 | 12,202 | |
Single Male w/Child | 14 | 908 | 1,957 | |
Single Female w/Child | 217 | 2,872 | 7,766 |
Population Change Last Two Decades - Plus Projection
2000 | % | 2010 | % | 2020 | % | 2030 | |
---|---|---|---|---|---|---|---|
Florida | 15,982,378 | +18 | 18,801,310 | +14 | 21,517,610 | +13 | 24,340,457 |
Orange County | 896,344 | +28 | 1,145,956 | +24 | 1,415,511 | +20 | 1,693,977 |
Total Working Age Population:
Total Households:
Total Working Age Population:
Total Households:
Total Working Age Population:
Total Households: