Industrial Properties
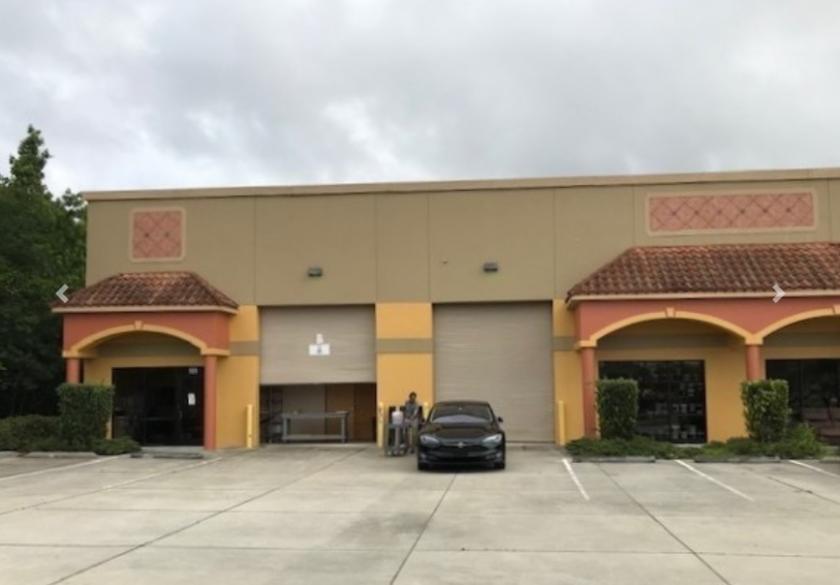
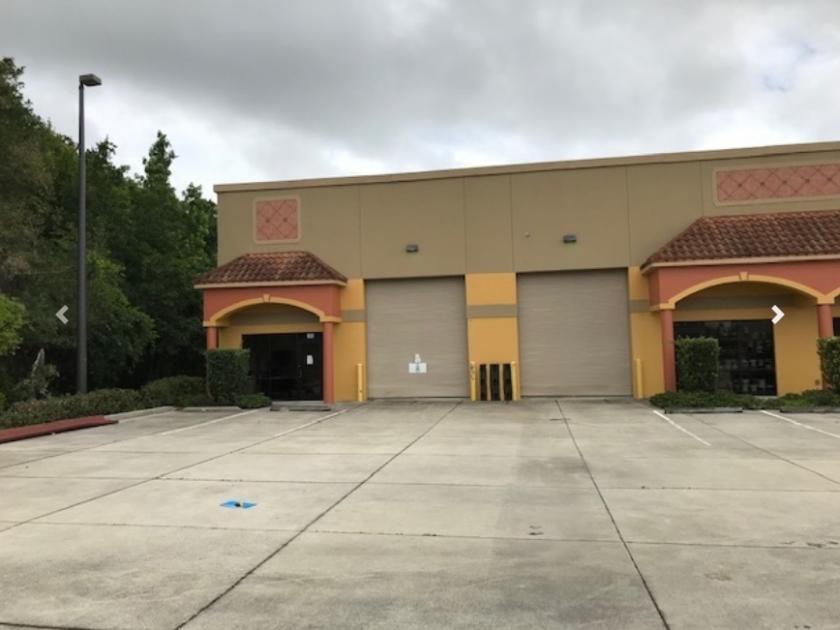
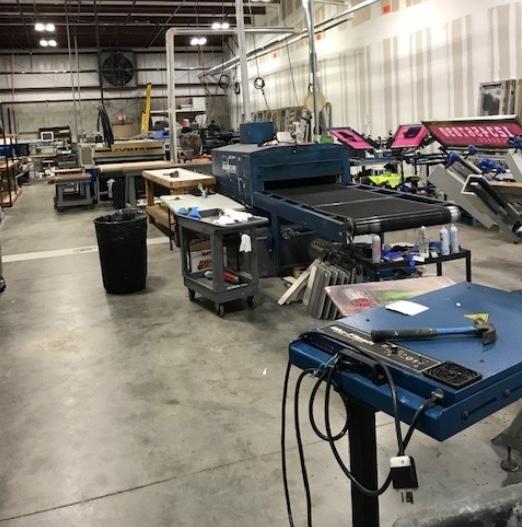
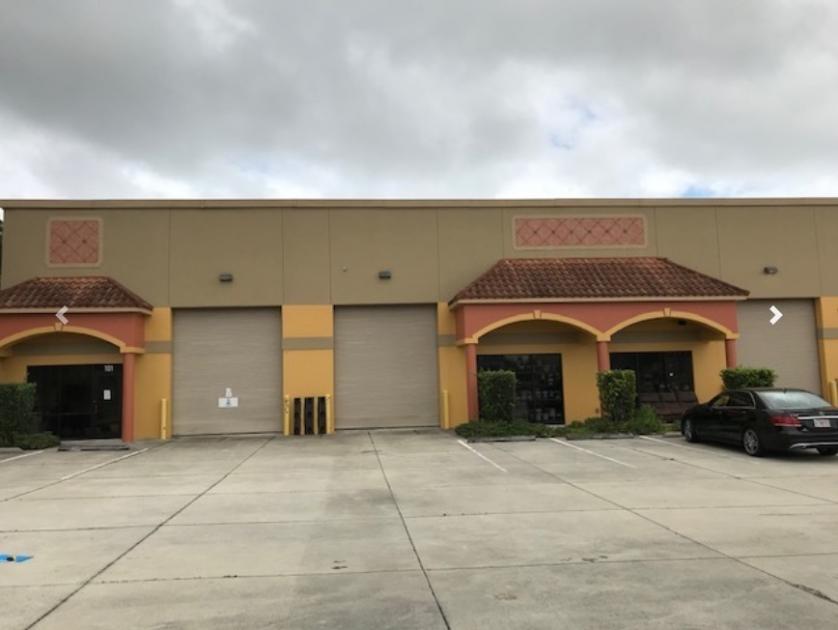
5031 Forsyth Commerce Road Orlando, FL 32807
5031 Forsyth Commerce Road Orlando, FL 32807
Details & Description
Additional Photos
Listing Agents

Michael Baxter
O: 386-999-1762
M: 386-999-1762
michael.baxter@svn.com
O: 386-999-1762
M: 386-999-1762
michael.baxter@svn.com
While we strive to provide the most accurate information, all listing information, and demographic data, is provided by third-parties. As such, MyEListing will not be responsible for the accuracy of the information. It is strongly recommended that you verify all information with the listing agent, and any relevant agencies, prior to making any decisions.


