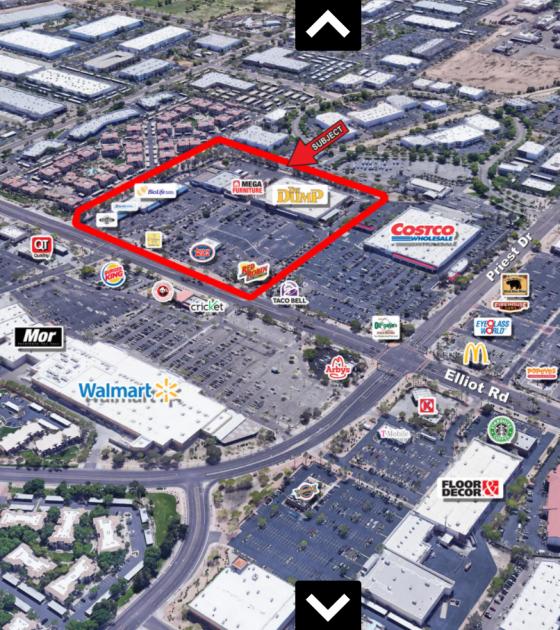
1-Mile | 3-Miles | 5-Miles | ||
---|---|---|---|---|
Total Population | 12,998 | 113,532 | 280,103 | |
Population Median Age | 34 | 37 | 36 | |
Population by Age | 0-9 Yrs | 1703 (13%) | 13010 (11%) | 30977 (11%) |
10-19 Yrs | 1113 (8%) | 13368 (11%) | 37517 (13%) | |
20-29 Yrs | 3462 (26%) | 21914 (19%) | 53108 (18%) | |
30-39 Yrs | 2216 (17%) | 17533 (15%) | 42127 (15%) | |
40-49 Yrs | 1381 (10%) | 13672 (12%) | 34527 (12%) | |
50-59 Yrs | 1445 (11%) | 14915 (13%) | 35818 (12%) | |
60-69 Yrs | 968 (7%) | 11686 (10%) | 27583 (9%) | |
70+ Yrs | 711 (5%) | 7434 (6%) | 18447 (6%) | |
Median HH Income | $58,806 | $65,744 | $69,573 | |
Total Household Income | < 24K | 804 (15%) | 6758 (15%) | 15163 (14%) |
25-49K | 1416 (26%) | 9466 (21%) | 21243 (20%) | |
50-74K | 1122 (21%) | 9261 (20%) | 20336 (19%) | |
75-99K | 843 (15%) | 6168 (13%) | 15119 (14%) | |
100-199K | 889 (16%) | 9926 (22%) | 25994 (24%) | |
200K+ | 238 (4%) | 3318 (7%) | 7328 (6%) | |
Highest Education Level | No Diploma | 869 | 5753 | 13123 |
Diploma or GED | 1369 | 13490 | 31375 | |
Some College | 2271 | 18177 | 43777 | |
Assoc. Degree | 584 | 6404 | 15935 | |
Bachelors Degree | 2331 | 20290 | 48456 | |
Higher Degree | 1292 | 13232 | 32167 | |
Total Housing Units | 5,751 | 48,869 | 113,578 | |
--Owner-Occupied | 1,494 | 22,945 | 57,313 | |
--Renter-Occupied | 3,817 | 21,952 | 47,869 | |
Owner-Occupied Values | < 100K | 171 | 2316 | 4182 |
100-199K | 366 | 4784 | 11124 | |
200-299K | 512 | 6834 | 19232 | |
300-399K | 194 | 4671 | 12865 | |
400-499K | 131 | 2046 | 5144 | |
500K+ | 120 | 2294 | 4767 | |
Total Working Age Population | 10,543 | 92,223 | 227,527 | |
In Work Force | 7,799 | 66,681 | 161,959 | |
Not In Work Force | 2,744 | 25,542 | 65,568 | |
Workforce Employed | 7,325 | 63,457 | 153,917 | |
Workforce Unemployed | 458 | 3,189 | 7,962 | |
Civlian Workforce | 7,783 | 66,646 | 161,878 | |
Military Workforce | 15 | 35 | 81 | |
Total Households | 5,311 | 44,897 | 105,182 | |
Family Households | 2,837 | 26,328 | 63,938 | |
Non-Family Households | 2,474 | 18,569 | 41,245 | |
Married Couple | 1,649 | 17,308 | 44,223 | |
Other Family | 1,188 | 9,020 | 19,715 | |
Married w/Child | 704 | 6,629 | 18,157 | |
Single Male w/Child | 203 | 1,406 | 3,069 | |
Single Female w/Child | 321 | 2,759 | 6,500 |
Population Change Last Two Decades - Plus Projection
2000 | % | 2010 | % | 2020 | % | 2030 | |
---|---|---|---|---|---|---|---|
Arizona | 5,130,632 | +25 | 6,392,017 | +14 | 7,286,100 | +14 | 8,284,900 |
Maricopa County | 3,072,149 | +24 | 3,817,117 | +16 | 4,436,900 | +15 | 5,107,700 |
Total Working Age Population:
Total Households:
Total Working Age Population:
Total Households:
Total Working Age Population:
Total Households: