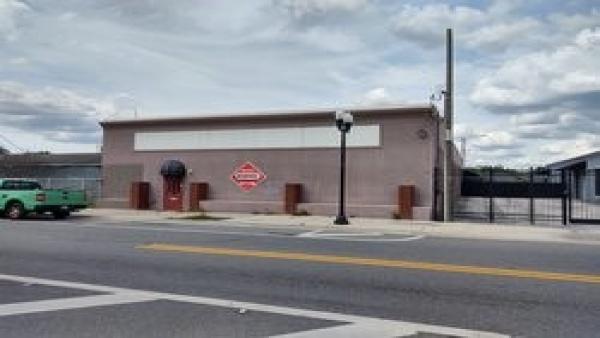
8,900 SF warehouse/flex space in Orlando’s Sports Corridor
* 6,500 SF air-conditioned, many office/warehouse configurations possible
* Two overhead doors and 14’max height
* Fenced and gated storage yard
* 3 blocks from Orlando City Soccer and Camping World Stadium
* Ideal for production, warehousing, automotive
* Retail or professional use also possible with frontage on Church St
* Convenient to I-4 and Hwy 408
* Sale Price Reduced to $1,150,000
Basic Details
MLS ID :O5852810Property Type :IndustrialListing Type :For salePrice :$1,150,000Year Built :1957Unit Size :0 SqftOffice Space :6,500 SqftWarehouse Space :8,900 SqftLot Area :14,157 SqftParking :YesZoning :I-G/T/PH
Address Map
Country :USState :FLCounty :OrangeCity :OrlandoZipcode :32805Street :ChurchStreet Number :1109Floor Number :0Longitude :W82° 36' 18.7''Latitude :N28° 32' 25.4''
No part of this information may be copied, reproduced, repurposed, or screen-captured for any commercial purpose without prior written authorization from MyEListing.
While we strive to provide the most accurate information, all listing information, and demographic data, is provided by third-parties. As such, MyEListing will not be responsible for the accuracy of the information. It is strongly recommended that you verify all information with the listing agent, and any relevant agencies, prior to making any decisions.
What is the asking price for 1109 West Church Street in Orlando?
The asking price for 1109 West Church Street is $1,150,000
What is the building size of this Industrial property in Orlando, FL?
The size of the building/unit at 1109 West Church Street in Orlando is 8,900 square feet
What kind of Industrial is the propery at 1109 West Church Street?
The property at 1109 West Church Street Orlando, FL 32805 is listed as a Warehouse Industrial property
What is the population within 1 mile of 1109 West Church Street in Orlando?
The population within 1 mile of 1109 West Church Street Orlando, FL 32805 is 10,477 people.
Who do I contact for questions about 1109 West Church Street?
You should contact the listing agent,
Charlie Brenner, for any details regarding this commercial listing.