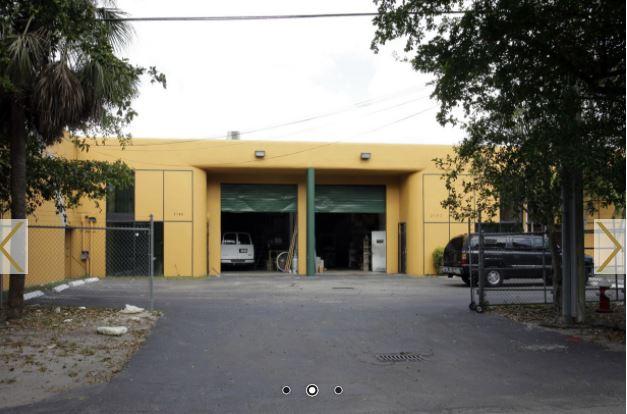
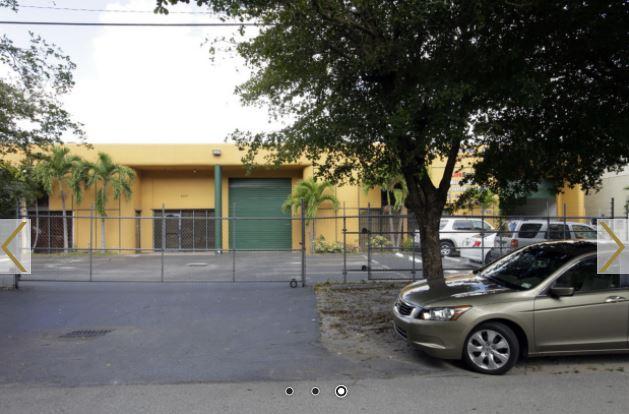
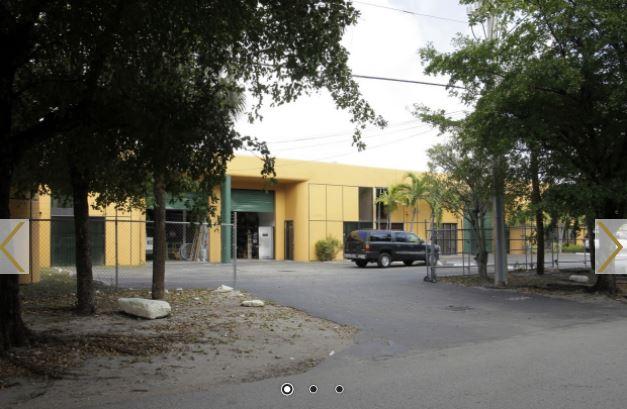
1-Mile | 3-Miles | 5-Miles | ||
---|---|---|---|---|
Total Population | 36,712 | 203,964 | 413,417 | |
Population Median Age | 42 | 41 | 40 | |
Population by Age | 0-9 Yrs | 3593 (9%) | 20304 (9%) | 43467 (10%) |
10-19 Yrs | 3910 (10%) | 22774 (11%) | 47364 (11%) | |
20-29 Yrs | 4871 (13%) | 25970 (12%) | 54375 (13%) | |
30-39 Yrs | 4238 (11%) | 25856 (12%) | 53008 (12%) | |
40-49 Yrs | 5815 (15%) | 31704 (15%) | 65110 (15%) | |
50-59 Yrs | 5458 (14%) | 30182 (14%) | 59585 (14%) | |
60-69 Yrs | 4236 (11%) | 21169 (10%) | 41181 (9%) | |
70+ Yrs | 4592 (12%) | 26007 (12%) | 49327 (11%) | |
Median HH Income | $38,539 | $41,851 | $42,418 | |
Total Household Income | < 24K | 3721 (33%) | 19382 (31%) | 39116 (31%) |
25-49K | 3157 (28%) | 16440 (26%) | 31850 (25%) | |
50-74K | 2104 (18%) | 11393 (18%) | 21744 (17%) | |
75-99K | 967 (8%) | 5869 (9%) | 12374 (9%) | |
100-199K | 1125 (10%) | 7788 (12%) | 16719 (13%) | |
200K+ | 160 (1%) | 1545 (2%) | 3219 (2%) | |
Highest Education Level | No Diploma | 5970 | 34220 | 68099 |
Diploma or GED | 9615 | 48744 | 94678 | |
Some College | 3762 | 21778 | 43782 | |
Assoc. Degree | 2475 | 14045 | 28377 | |
Bachelors Degree | 3733 | 20749 | 42341 | |
Higher Degree | 1233 | 8905 | 19386 | |
Total Housing Units | 11,686 | 65,105 | 133,679 | |
--Owner-Occupied | 5,923 | 33,398 | 66,210 | |
--Renter-Occupied | 5,311 | 29,020 | 58,812 | |
Owner-Occupied Values | < 100K | 869 | 4368 | 7121 |
100-199K | 2278 | 10544 | 19370 | |
200-299K | 1786 | 9593 | 19925 | |
300-399K | 745 | 5375 | 11636 | |
400-499K | 94 | 1952 | 4406 | |
500K+ | 152 | 1565 | 3752 | |
Total Working Age Population | 30,925 | 170,395 | 341,633 | |
In Work Force | 19,190 | 104,690 | 208,533 | |
Not In Work Force | 11,735 | 65,705 | 133,101 | |
Workforce Employed | 18,220 | 99,350 | 197,534 | |
Workforce Unemployed | 948 | 5,266 | 10,883 | |
Civlian Workforce | 19,169 | 104,616 | 208,417 | |
Military Workforce | 22 | 75 | 116 | |
Total Households | 11,234 | 62,418 | 125,021 | |
Family Households | 8,550 | 47,380 | 93,288 | |
Non-Family Households | 2,684 | 15,037 | 31,734 | |
Married Couple | 5,384 | 30,133 | 58,478 | |
Other Family | 3,166 | 17,247 | 34,809 | |
Married w/Child | 1,798 | 11,764 | 23,536 | |
Single Male w/Child | 263 | 1,788 | 3,289 | |
Single Female w/Child | 1,034 | 5,589 | 11,891 |
Population Change Last Two Decades - Plus Projection
2000 | % | 2010 | % | 2020 | % | 2030 | |
---|---|---|---|---|---|---|---|
Florida | 15,982,378 | +18 | 18,801,310 | +14 | 21,517,610 | +13 | 24,340,457 |
Miami-Dade County | 2,253,362 | +11 | 2,496,435 | +15 | 2,861,579 | +11 | 3,190,242 |
Broward County | 1,623,018 | +8 | 1,748,066 | +11 | 1,942,686 | +9 | 2,120,334 |
Total Working Age Population:
Total Households:
Total Working Age Population:
Total Households:
Total Working Age Population:
Total Households: