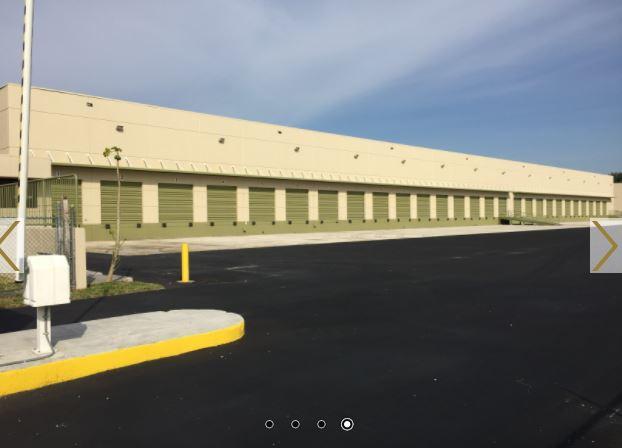
Industrial Properties
8105 Northwest 77th Street Medley, FL 33166
8105 Northwest 77th Street Medley, FL 33166

Details & Description
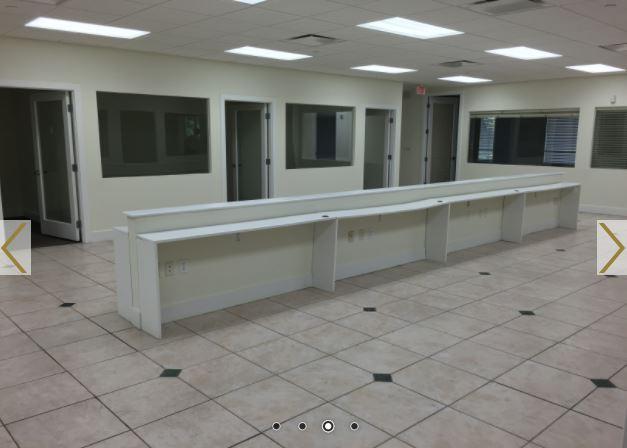
Additional Photos

Listing Agents

Carlos Velasquez
O: 305-817-8899
cvelasquez@vivogroup.net
O: 305-817-8899
cvelasquez@vivogroup.net

Tommy Gil
O: 305-817-8899
M: 305-975-3209
Tgil@vivogroup.net
O: 305-817-8899
M: 305-975-3209
Tgil@vivogroup.net
While we strive to provide the most accurate information, all listing information, and demographic data, is provided by third-parties. As such, MyEListing will not be responsible for the accuracy of the information. It is strongly recommended that you verify all information with the listing agent, and any relevant agencies, prior to making any decisions.


