Industrial Properties
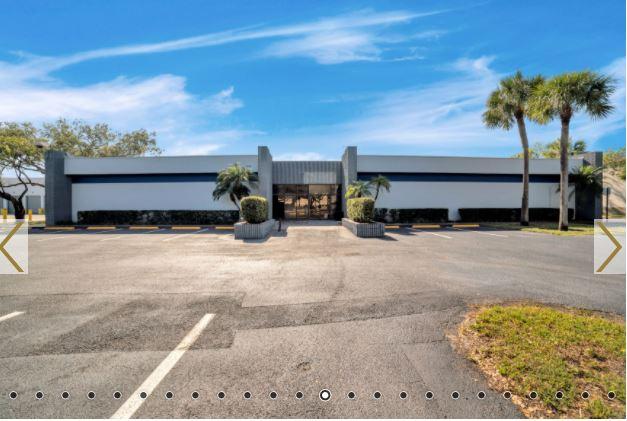
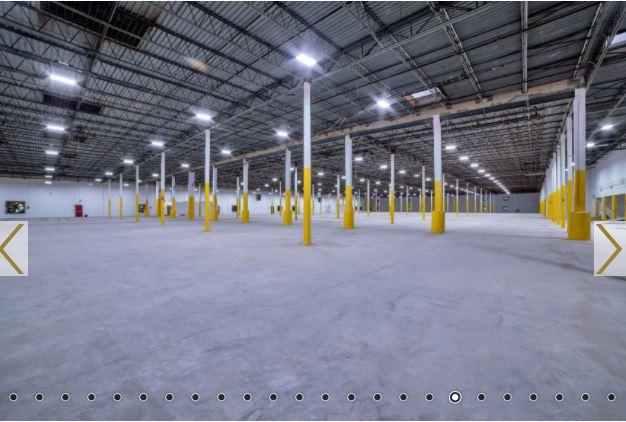
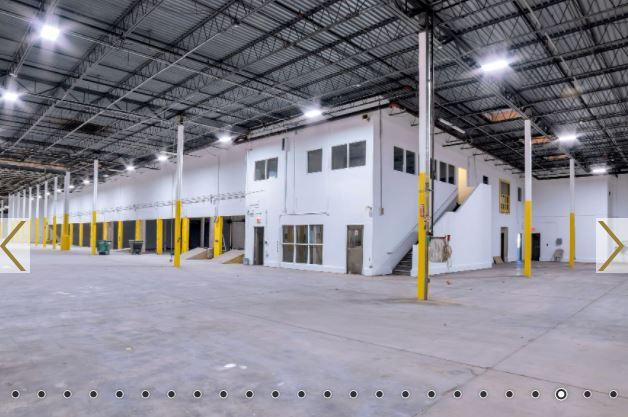
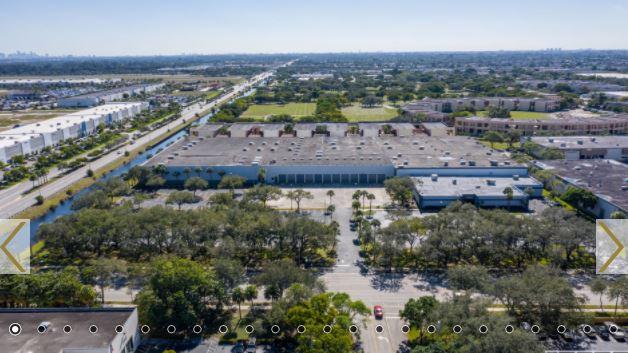
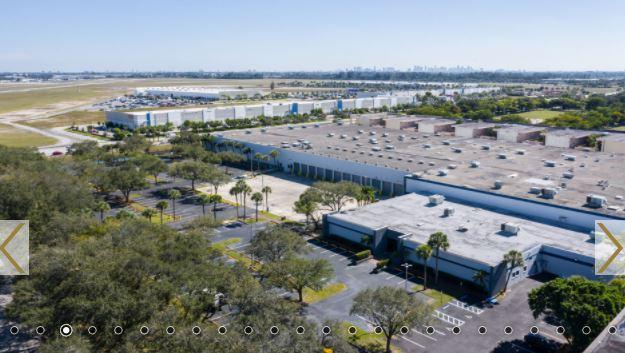
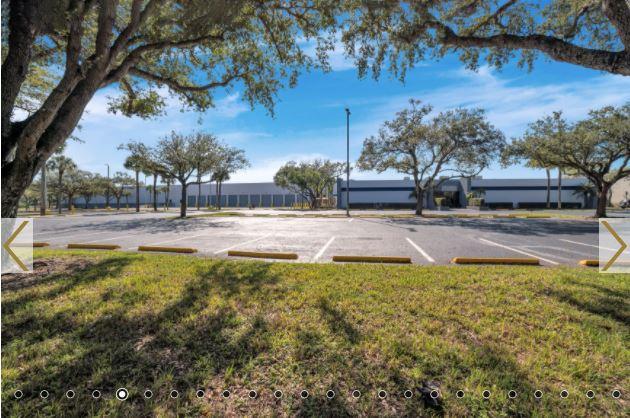
5770 Miami Lakes Drive Miami Lakes, FL 33014
5770 Miami Lakes Drive Miami Lakes, FL 33014
Details & Description
Additional Photos


Listing Agents

Rene Vivo
O: 305-817-8899
M: 305-785-4905
Rvivo@vivogroup.net
O: 305-817-8899
M: 305-785-4905
Rvivo@vivogroup.net

Carlos Velasquez
O: 305-817-8899
cvelasquez@vivogroup.net
O: 305-817-8899
cvelasquez@vivogroup.net
While we strive to provide the most accurate information, all listing information, and demographic data, is provided by third-parties. As such, MyEListing will not be responsible for the accuracy of the information. It is strongly recommended that you verify all information with the listing agent, and any relevant agencies, prior to making any decisions.