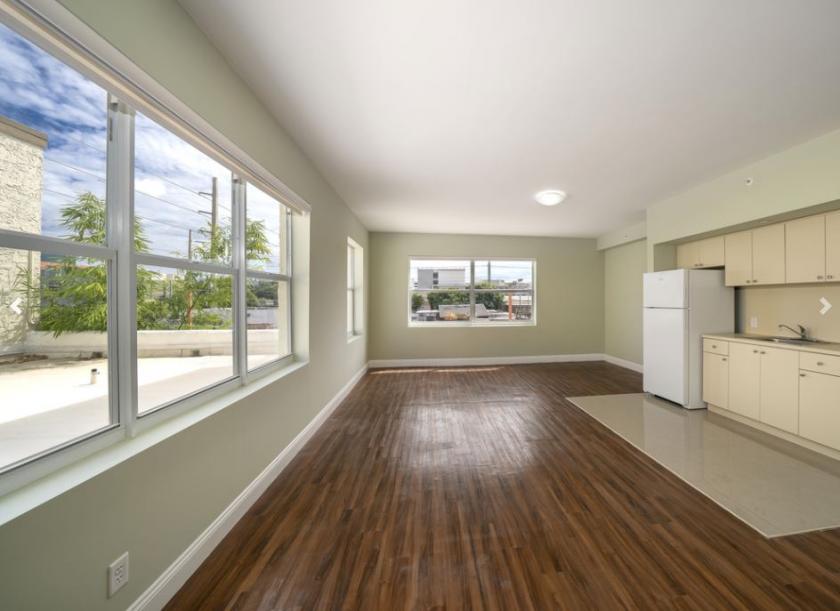
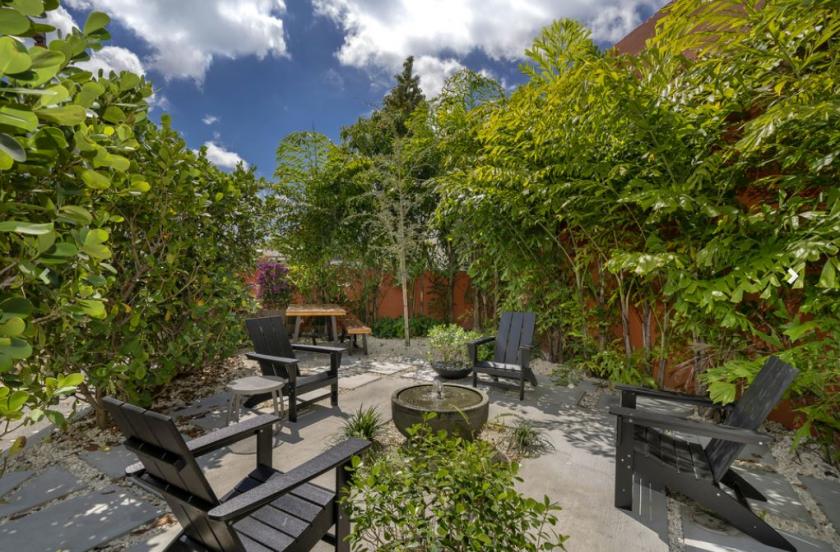
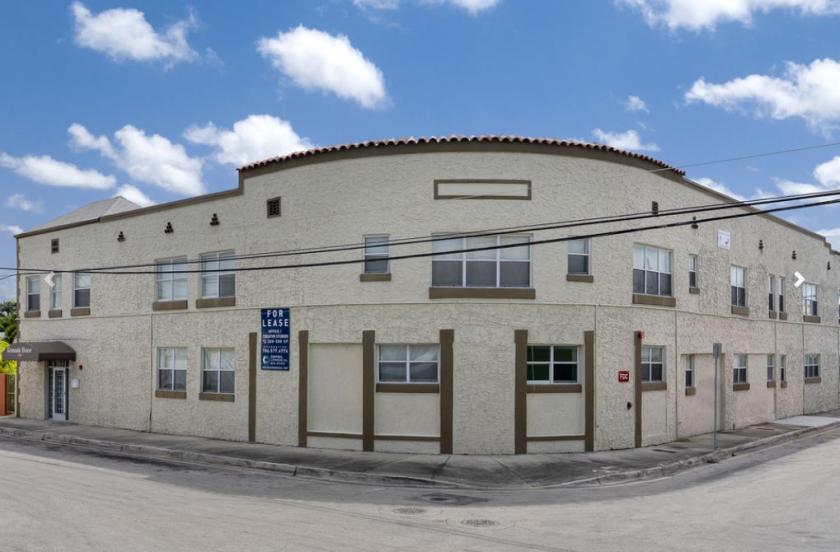
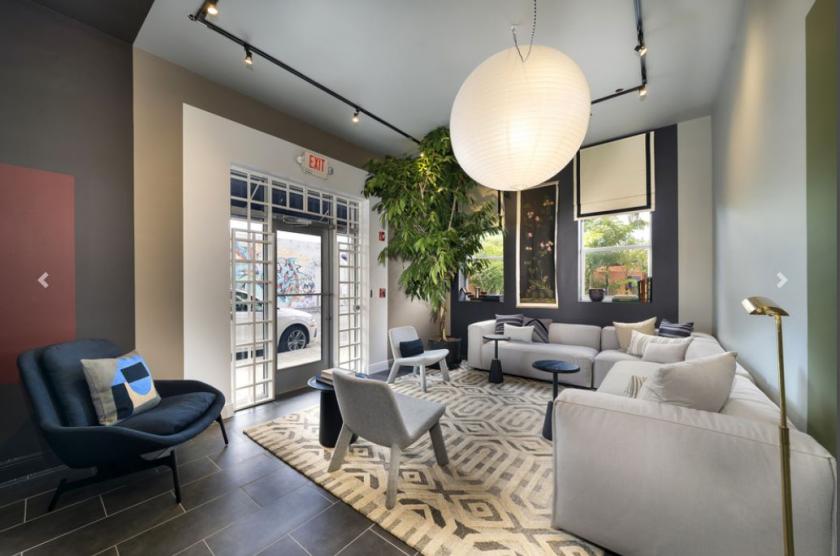
Office Space
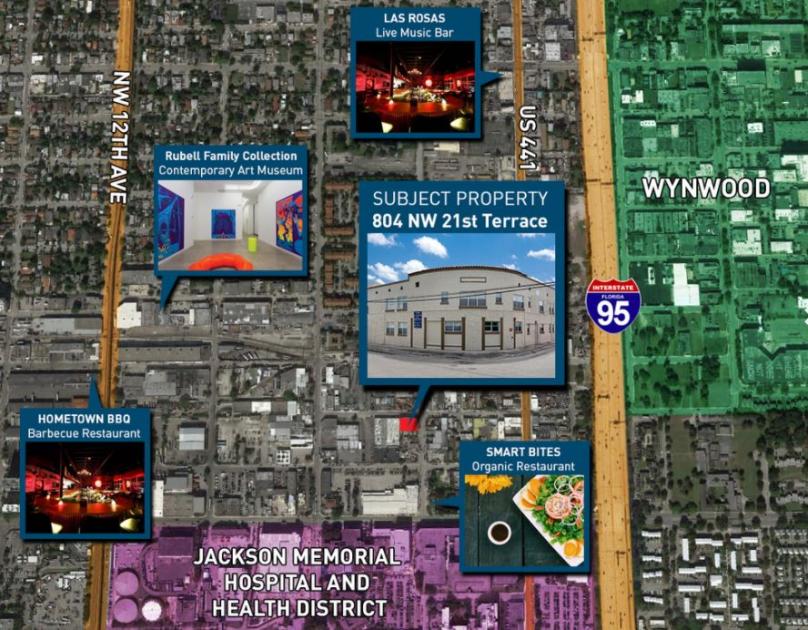
804 Northwest 21st Terrace Miami, FL 33127
804 Northwest 21st Terrace Miami, FL 33127
Details & Description
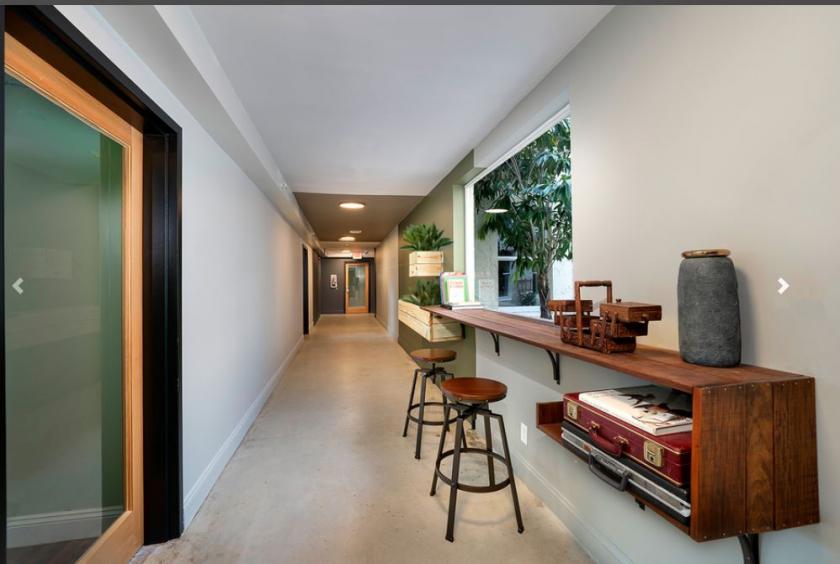
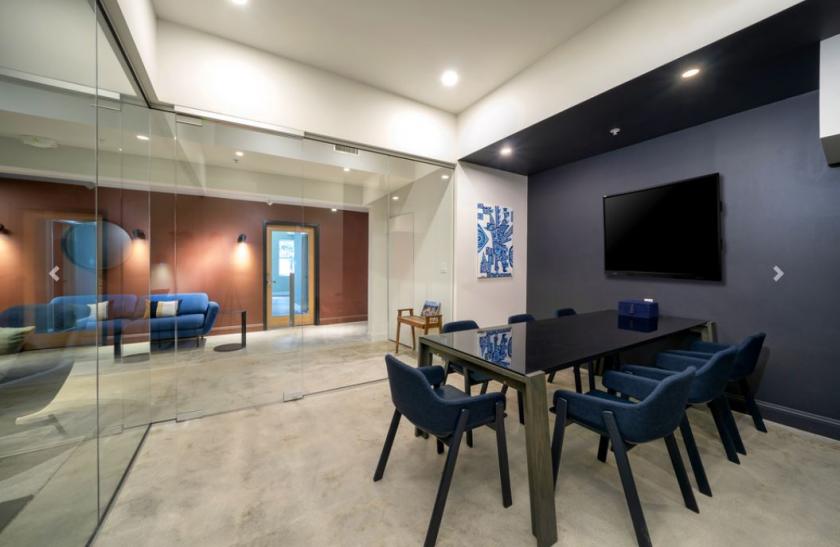
Additional Photos

Listing Agents

Diamela Burguera
O: 786-577-4974
dburguera@centralcommercialre.com
O: 786-577-4974
dburguera@centralcommercialre.com

Eric Gonzalez
O: 786-577-4974
M: 305-302-0672
eric@centralcommercialre.com
O: 786-577-4974
M: 305-302-0672
eric@centralcommercialre.com
While we strive to provide the most accurate information, all listing information, and demographic data, is provided by third-parties. As such, MyEListing will not be responsible for the accuracy of the information. It is strongly recommended that you verify all information with the listing agent, and any relevant agencies, prior to making any decisions.