Industrial Properties
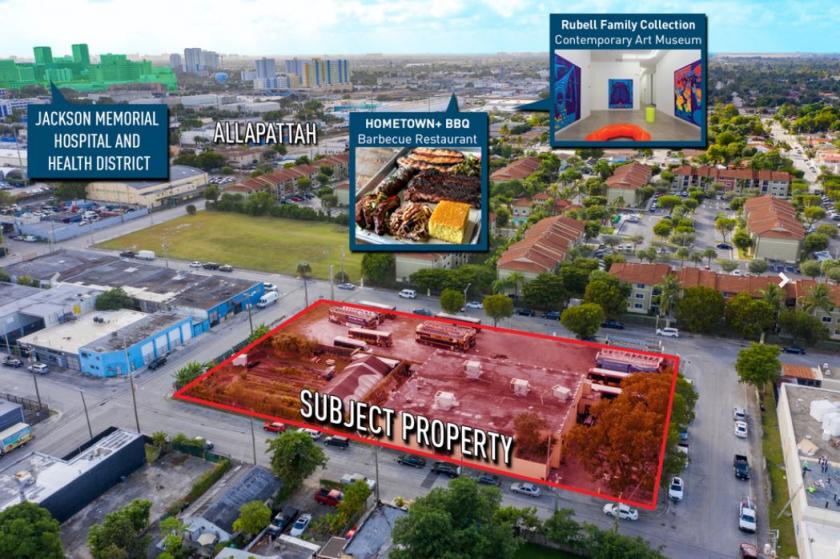
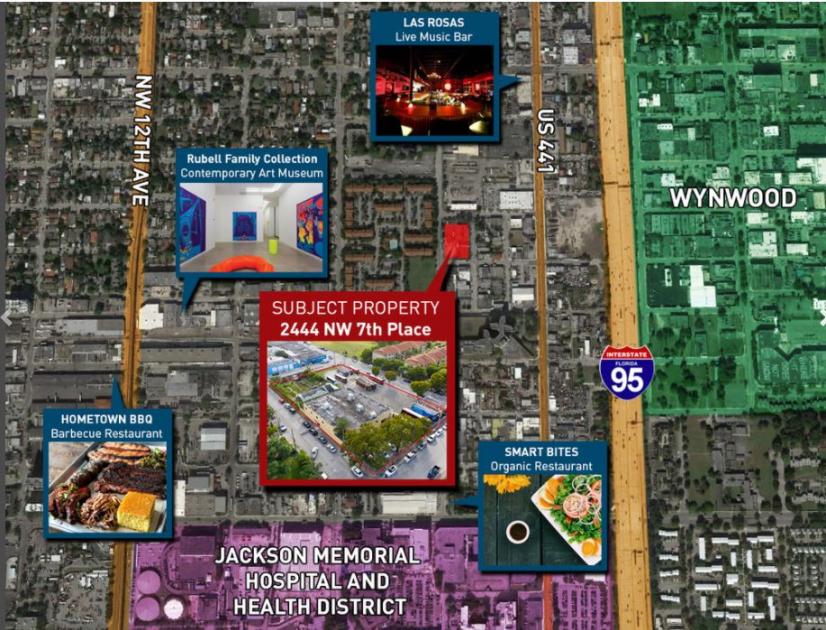
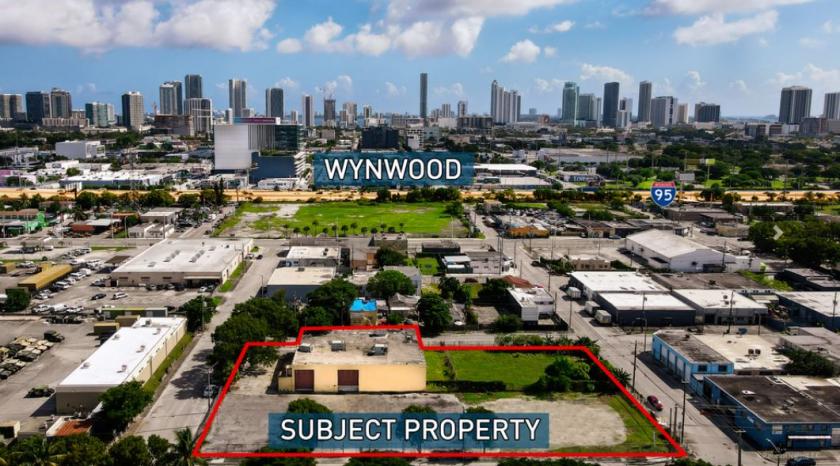
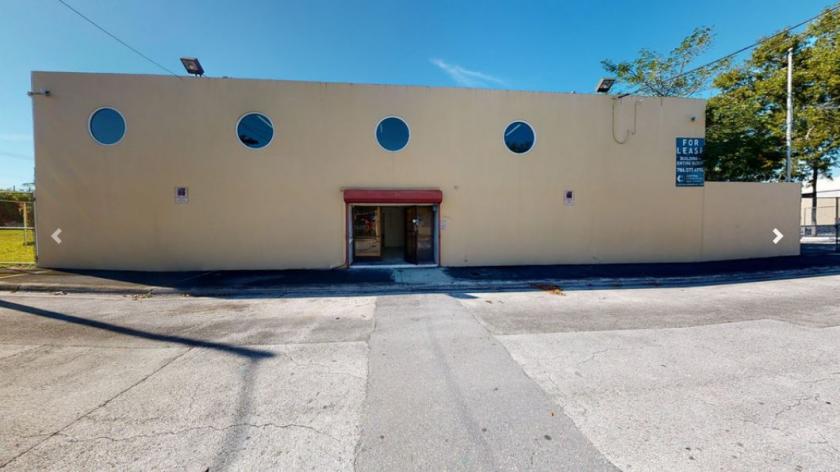
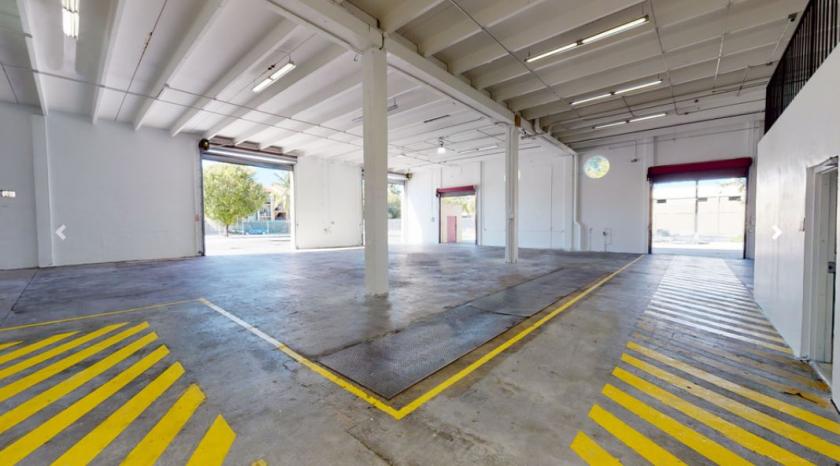
2444 Northwest 7th Place Miami, FL 33127
2444 Northwest 7th Place Miami, FL 33127
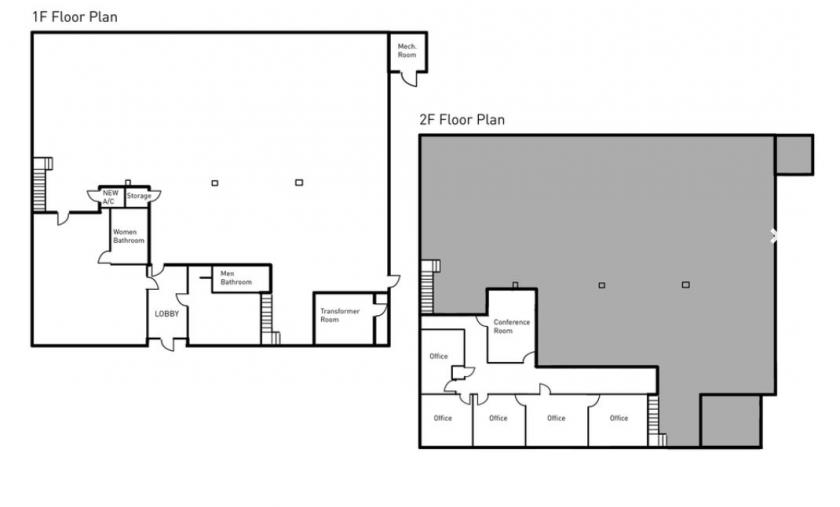
Details & Description
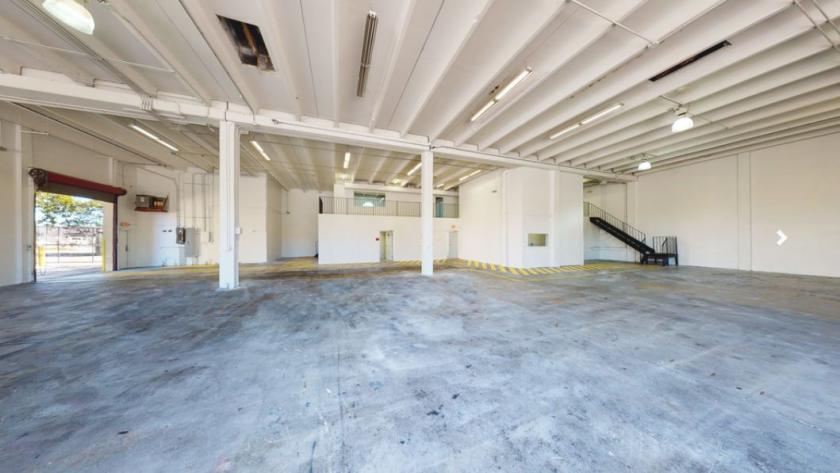
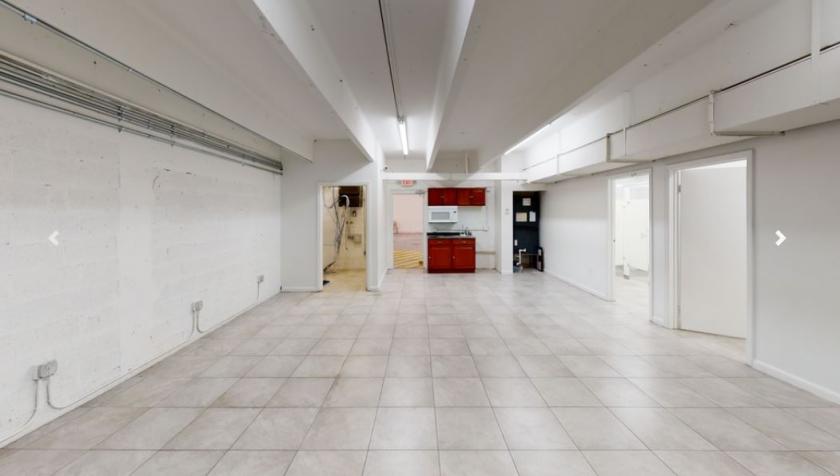
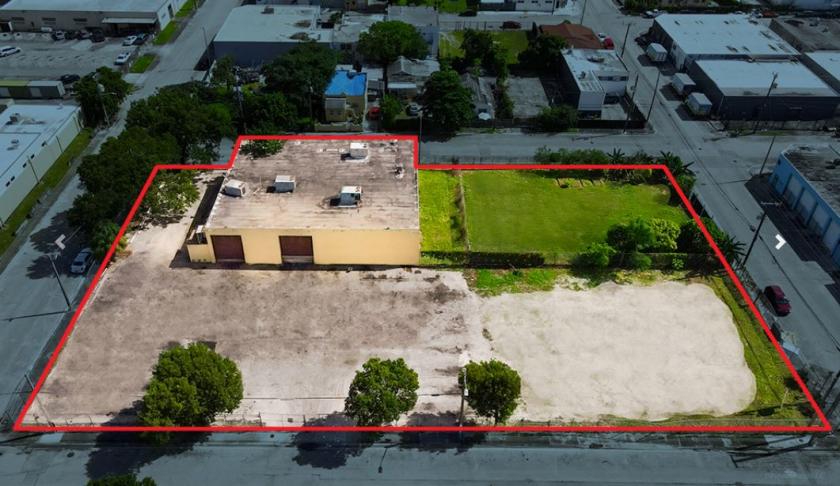
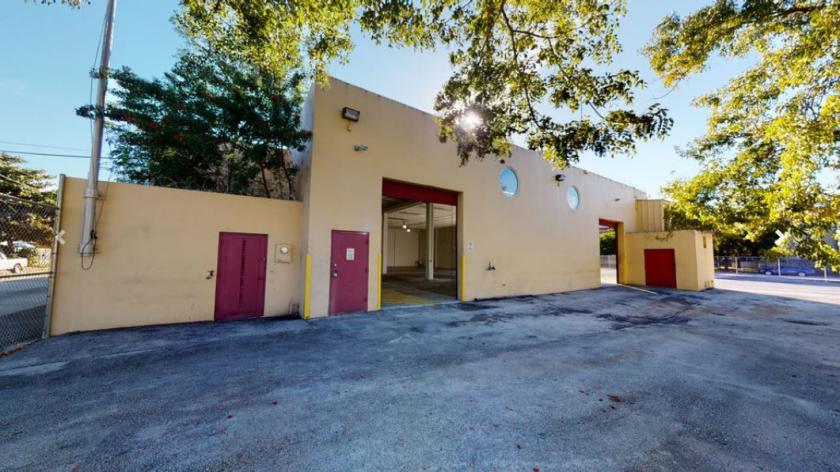
Additional Photos
Listing Agents

Ari Dispenza
O: 786-577-4974
M: 786-556-8998
ari@centralcommercialre.com
O: 786-577-4974
M: 786-556-8998
ari@centralcommercialre.com

Eric Gonzalez
O: 786-577-4974
M: 305-302-0672
eric@centralcommercialre.com
O: 786-577-4974
M: 305-302-0672
eric@centralcommercialre.com
While we strive to provide the most accurate information, all listing information, and demographic data, is provided by third-parties. As such, MyEListing will not be responsible for the accuracy of the information. It is strongly recommended that you verify all information with the listing agent, and any relevant agencies, prior to making any decisions.