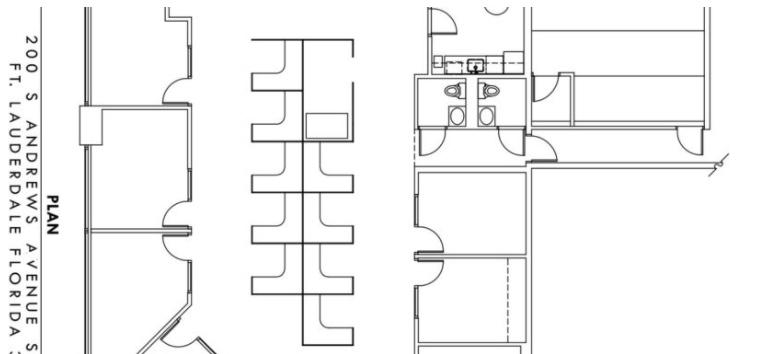
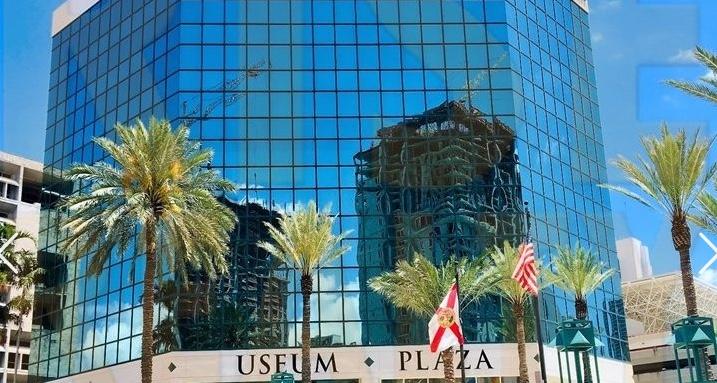
1-Mile | 3-Miles | 5-Miles | ||
---|---|---|---|---|
Total Population | 22,465 | 135,285 | 296,775 | |
Population Median Age | 41 | 40 | 40 | |
Population by Age | 0-9 Yrs | 1587 (7%) | 13512 (9%) | 34353 (11%) |
10-19 Yrs | 1494 (6%) | 13786 (10%) | 31209 (10%) | |
20-29 Yrs | 3867 (17%) | 18925 (13%) | 40809 (13%) | |
30-39 Yrs | 4557 (20%) | 20513 (15%) | 42249 (14%) | |
40-49 Yrs | 3057 (13%) | 17689 (13%) | 38570 (12%) | |
50-59 Yrs | 3419 (15%) | 21533 (15%) | 45098 (15%) | |
60-69 Yrs | 2914 (12%) | 16338 (12%) | 35018 (11%) | |
70+ Yrs | 1570 (6%) | 12989 (9%) | 29468 (9%) | |
Median HH Income | $64,073 | $52,334 | $50,365 | |
Total Household Income | < 24K | 2585 (23%) | 13758 (24%) | 27840 (24%) |
25-49K | 2014 (18%) | 13316 (23%) | 28163 (24%) | |
50-74K | 1393 (12%) | 8729 (15%) | 19520 (17%) | |
75-99K | 1111 (10%) | 5685 (10%) | 11598 (10%) | |
100-199K | 2354 (21%) | 9465 (16%) | 17687 (15%) | |
200K+ | 1349 (12%) | 4980 (8%) | 7850 (6%) | |
Highest Education Level | No Diploma | 1926 | 14149 | 32079 |
Diploma or GED | 2838 | 24588 | 59791 | |
Some College | 2677 | 18297 | 39907 | |
Assoc. Degree | 1816 | 8641 | 18752 | |
Bachelors Degree | 5305 | 22330 | 40760 | |
Higher Degree | 3659 | 13205 | 23711 | |
Total Housing Units | 13,659 | 71,389 | 140,529 | |
--Owner-Occupied | 3,603 | 25,861 | 58,054 | |
--Renter-Occupied | 7,204 | 30,074 | 54,605 | |
Owner-Occupied Values | < 100K | 128 | 2395 | 7964 |
100-199K | 408 | 5522 | 15485 | |
200-299K | 483 | 4730 | 11527 | |
300-399K | 814 | 3900 | 7868 | |
400-499K | 477 | 2376 | 4218 | |
500K+ | 1292 | 6937 | 10991 | |
Total Working Age Population | 20,180 | 113,563 | 243,323 | |
In Work Force | 13,953 | 75,207 | 159,580 | |
Not In Work Force | 6,227 | 38,357 | 83,743 | |
Workforce Employed | 13,089 | 69,356 | 146,500 | |
Workforce Unemployed | 857 | 5,796 | 13,007 | |
Civlian Workforce | 13,947 | 75,152 | 159,507 | |
Military Workforce | 6 | 55 | 72 | |
Total Households | 10,806 | 55,934 | 112,658 | |
Family Households | 4,240 | 25,928 | 59,916 | |
Non-Family Households | 6,566 | 30,007 | 52,743 | |
Married Couple | 2,819 | 16,368 | 36,643 | |
Other Family | 1,421 | 9,559 | 23,273 | |
Married w/Child | 776 | 5,043 | 12,120 | |
Single Male w/Child | 106 | 956 | 2,065 | |
Single Female w/Child | 511 | 3,606 | 8,615 |
Population Change Last Two Decades - Plus Projection
2000 | % | 2010 | % | 2020 | % | 2030 | |
---|---|---|---|---|---|---|---|
Florida | 15,982,378 | +18 | 18,801,310 | +14 | 21,517,610 | +13 | 24,340,457 |
Broward County | 1,623,018 | +8 | 1,748,066 | +11 | 1,942,686 | +9 | 2,120,334 |
Total Working Age Population:
Total Households:
Total Working Age Population:
Total Households:
Total Working Age Population:
Total Households: