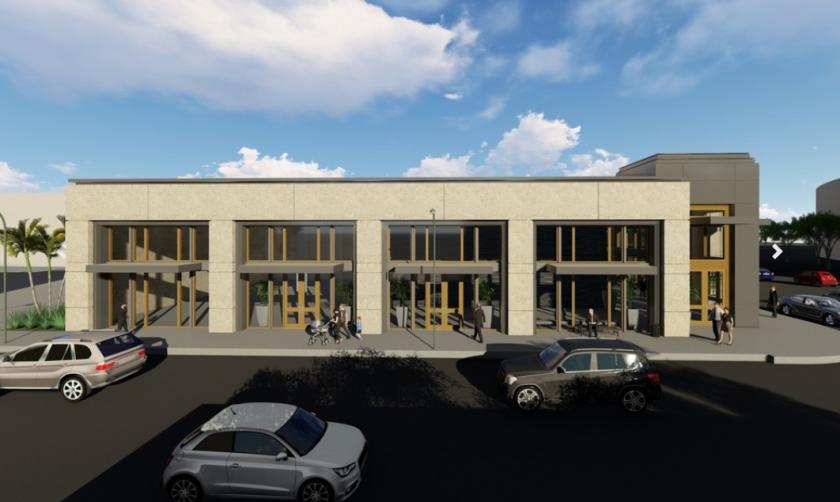
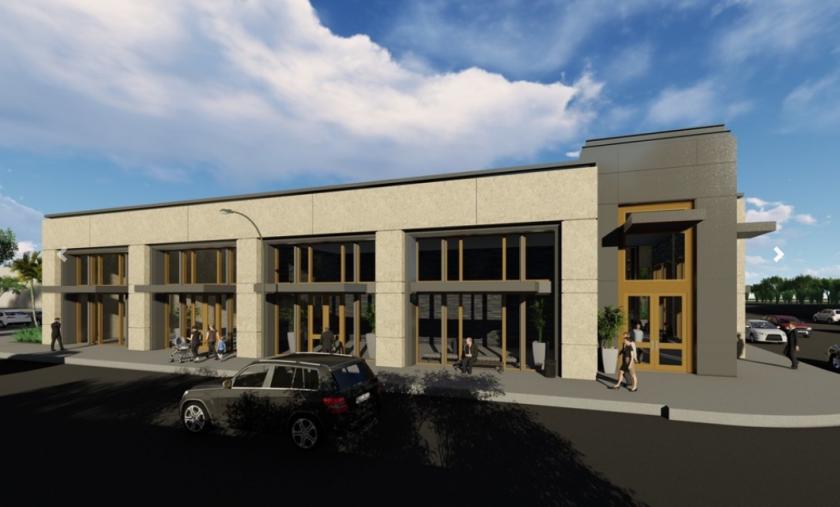
1-Mile | 3-Miles | 5-Miles | ||
---|---|---|---|---|
Total Population | 30,103 | 260,479 | 533,246 | |
Population Median Age | 44 | 43 | 41 | |
Population by Age | 0-9 Yrs | 2792 (9%) | 24516 (9%) | 52128 (9%) |
10-19 Yrs | 2176 (7%) | 24587 (9%) | 50197 (9%) | |
20-29 Yrs | 3630 (12%) | 33227 (12%) | 73604 (13%) | |
30-39 Yrs | 4419 (14%) | 35548 (13%) | 79431 (14%) | |
40-49 Yrs | 4581 (15%) | 38576 (14%) | 76825 (14%) | |
50-59 Yrs | 4465 (14%) | 36449 (13%) | 74069 (13%) | |
60-69 Yrs | 3520 (11%) | 29038 (11%) | 57392 (10%) | |
70+ Yrs | 4519 (15%) | 38539 (14%) | 69600 (13%) | |
Median HH Income | $64,039 | $45,357 | $43,418 | |
Total Household Income | < 24K | 2714 (21%) | 26564 (29%) | 60720 (31%) |
25-49K | 2581 (20%) | 22270 (24%) | 44938 (23%) | |
50-74K | 1897 (14%) | 13550 (14%) | 28096 (14%) | |
75-99K | 1332 (10%) | 7832 (8%) | 17354 (9%) | |
100-199K | 2757 (21%) | 13507 (14%) | 26575 (13%) | |
200K+ | 1528 (11%) | 6869 (7%) | 13732 (7%) | |
Highest Education Level | No Diploma | 1933 | 36869 | 79159 |
Diploma or GED | 4313 | 56448 | 110362 | |
Some College | 3156 | 24737 | 50547 | |
Assoc. Degree | 1785 | 15609 | 30984 | |
Bachelors Degree | 6653 | 35749 | 74930 | |
Higher Degree | 5873 | 25847 | 51769 | |
Total Housing Units | 15,228 | 100,962 | 221,221 | |
--Owner-Occupied | 5,353 | 40,914 | 75,532 | |
--Renter-Occupied | 7,457 | 49,678 | 115,883 | |
Owner-Occupied Values | < 100K | 229 | 2133 | 4637 |
100-199K | 398 | 5702 | 11319 | |
200-299K | 759 | 9273 | 16601 | |
300-399K | 816 | 7867 | 14489 | |
400-499K | 553 | 4294 | 7650 | |
500K+ | 2598 | 11646 | 20836 | |
Total Working Age Population | 25,955 | 222,215 | 452,075 | |
In Work Force | 17,283 | 136,515 | 278,837 | |
Not In Work Force | 8,673 | 85,699 | 173,238 | |
Workforce Employed | 16,642 | 128,785 | 262,829 | |
Workforce Unemployed | 634 | 7,699 | 15,843 | |
Civlian Workforce | 17,276 | 136,483 | 278,672 | |
Military Workforce | 7 | 32 | 165 | |
Total Households | 12,810 | 90,592 | 191,416 | |
Family Households | 7,096 | 58,084 | 115,442 | |
Non-Family Households | 5,713 | 32,508 | 75,973 | |
Married Couple | 5,238 | 37,249 | 73,371 | |
Other Family | 1,859 | 20,835 | 42,071 | |
Married w/Child | 1,637 | 13,306 | 27,018 | |
Single Male w/Child | 222 | 1,916 | 3,800 | |
Single Female w/Child | 678 | 5,699 | 12,749 |
Population Change Last Two Decades - Plus Projection
2000 | % | 2010 | % | 2020 | % | 2030 | |
---|---|---|---|---|---|---|---|
Florida | 15,982,378 | +18 | 18,801,310 | +14 | 21,517,610 | +13 | 24,340,457 |
Miami-Dade County | 2,253,362 | +11 | 2,496,435 | +15 | 2,861,579 | +11 | 3,190,242 |
Total Working Age Population:
Total Households:
Total Working Age Population:
Total Households:
Total Working Age Population:
Total Households: