Description
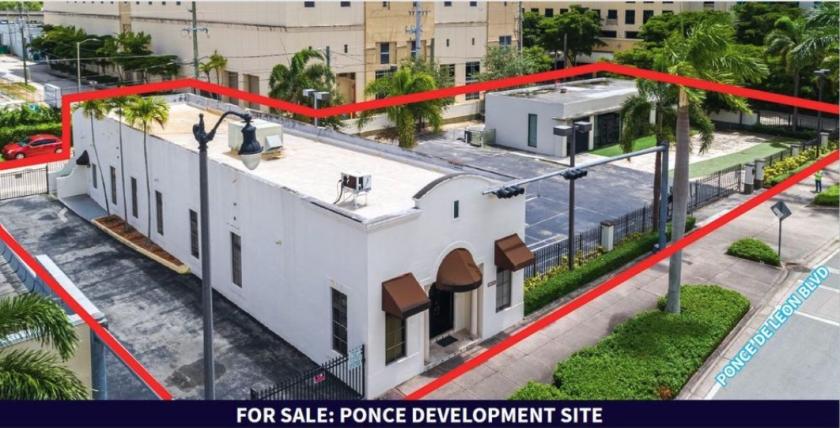
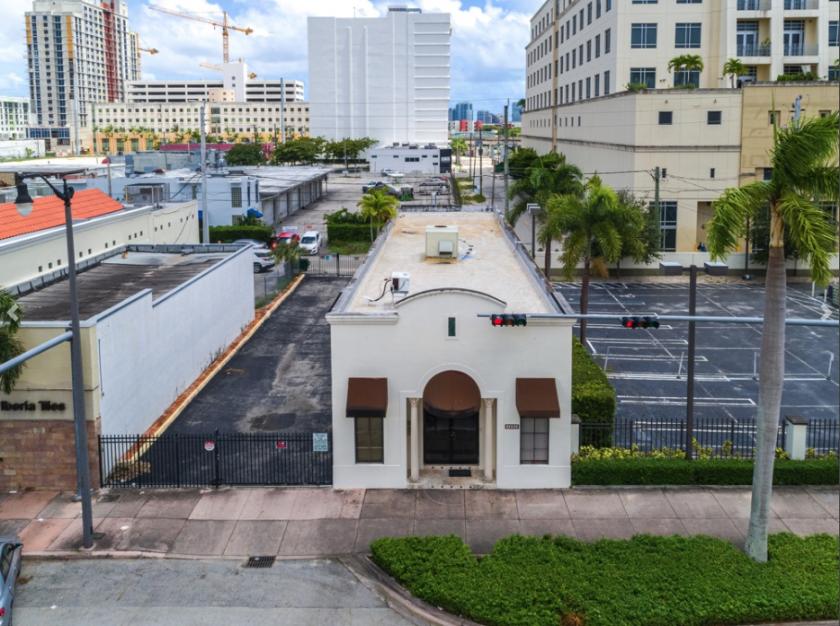
Avison Young is pleased to present 4225 & 4311 Ponce de Leon Boulevard (“the Property”), a
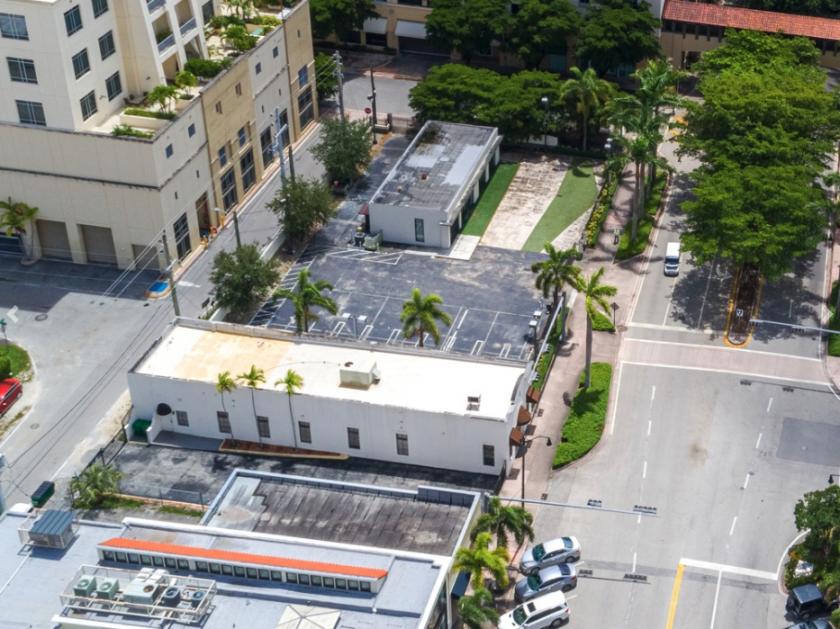
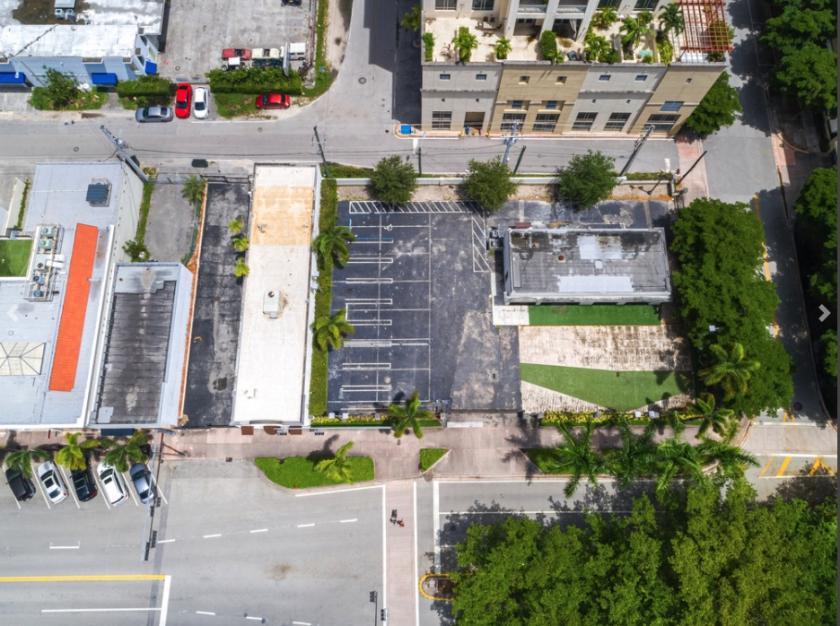
±0.46 AC (±20,035 SF) mixed-use development opportunity located in desirable Coral Gables’ popular Merrick Park neighborhood.
With nearly half-acre footprint and 200 feet of frontage along Ponce de Leon Boulevard, the Property is ideally suited for development of multiple uses such as office, hotel, retail and multifamily with a 3.5 FAR at a maximum density of 70,000 square feet up to a height of 100 feet.
Highlights
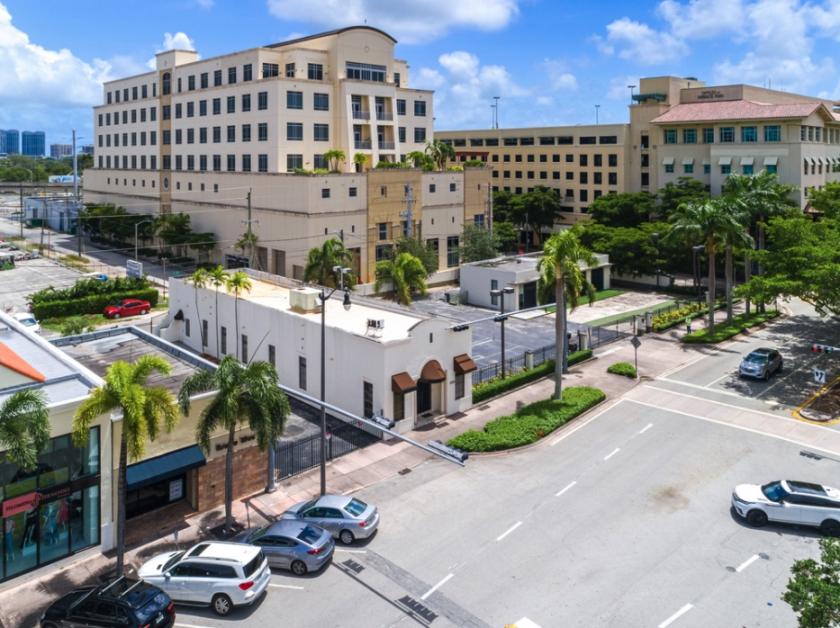
Coral Gables is one of South Florida’s most affluent neighborhoods. It is celebrated for its Mediterranean Revival architectural style and having some of Miami-Dade County’s most desirable residential neighborhoods. The average income in Coral Gables approximated $171,000 per household in 2019, and the median home value within a 1-mile radius of the Property is over $610,000.
Coral Gables is one of the cities in Miami-Dade County that people love and consider to be very safe to live, work, and play. It is consistently ranked as one of the safest places and most distinguished communities to live in the State of Florida.
Both parcels are zoned Commercial and located in the North Industrial Mixed-Use Overlay District (MXD), allowing for multifamily residential, office, retail or hotel. As-of-right zoning allows up to 3.0 FAR (3.5 FAR with Bonus) and a 10-story building up to 100 feet in height.
The Coral Gables city commission may also approve up to 20 feet of additional height for the purpose of achieving increased floor to ceiling height in the multifamily residences.
No part of this information may be copied, reproduced, repurposed, or screen-captured for any commercial purpose without prior written authorization from MyEListing.
While we strive to provide the most accurate information, all listing information, and demographic data, is provided by third-parties. As such, MyEListing will not be responsible for the accuracy of the information. It is strongly recommended that you verify all information with the listing agent, and any relevant agencies, prior to making any decisions.
How much land does the Miami, FL property at 4311 Ponce de Leon Blvd Miami FL 33146 USA include?
4311 Ponce de Leon Blvd Miami FL 33146 USA in Miami includes 0.460 acres of land
What is the population within 1 mile of 4311 Ponce de Leon Blvd Miami FL 33146 USA in Miami?
The population within 1 mile of 4311 Ponce de Leon Blvd Miami FL 33146 USA Miami, FL 33146 is 16,849 people.
Who do I contact for questions about 4311 Ponce de Leon Blvd Miami FL 33146 USA?
You should contact the listing agent,
Michael Fay, for any details regarding this commercial listing.