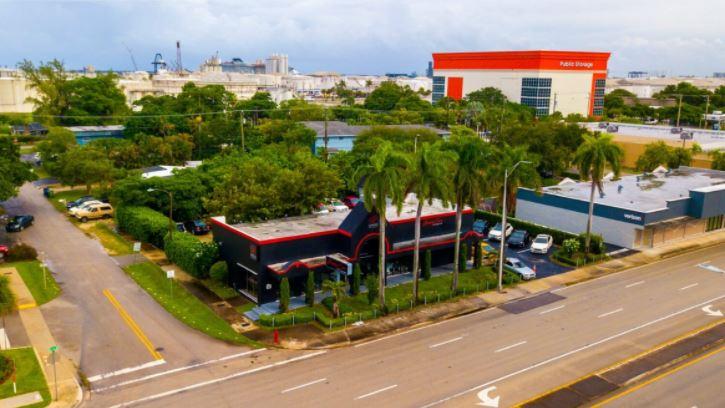
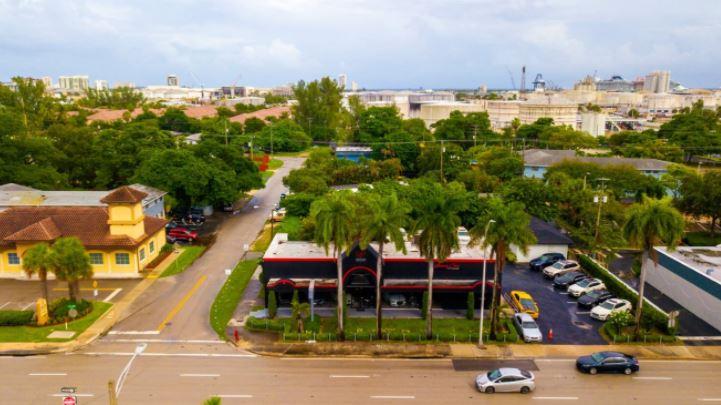
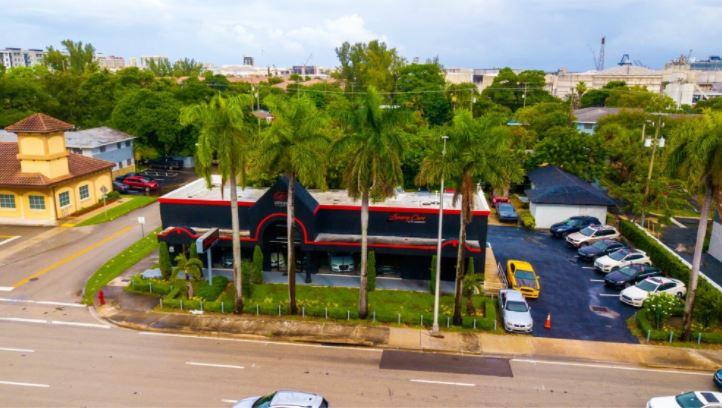
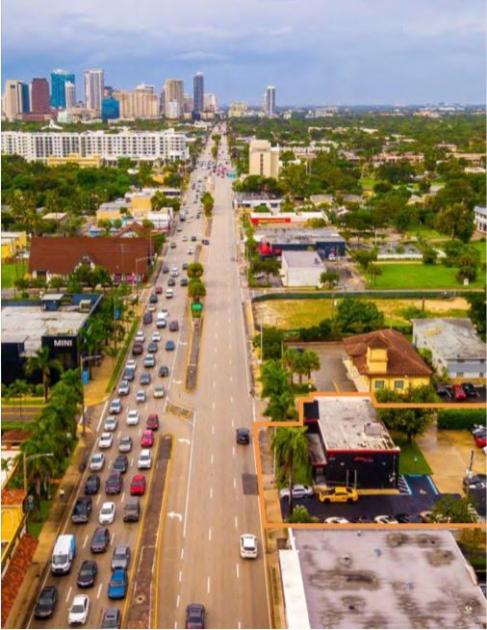
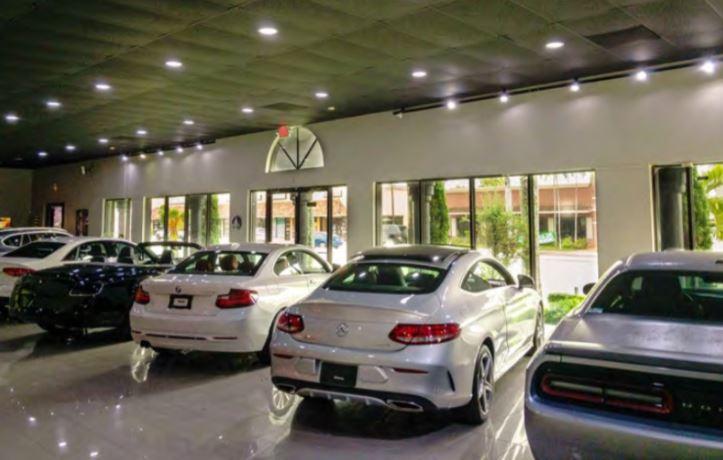
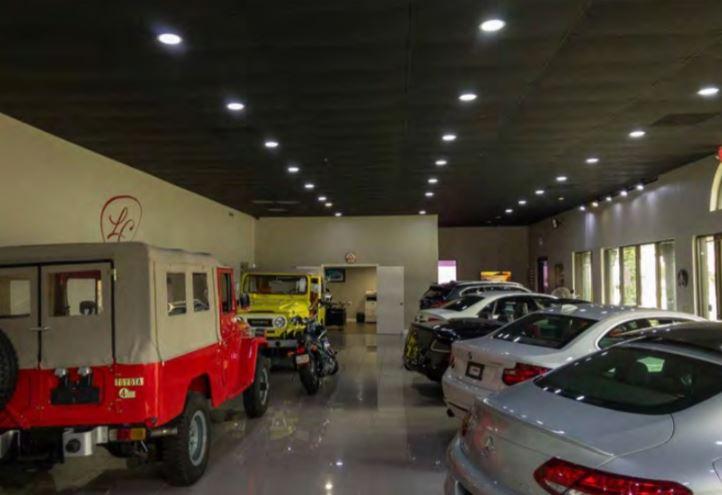
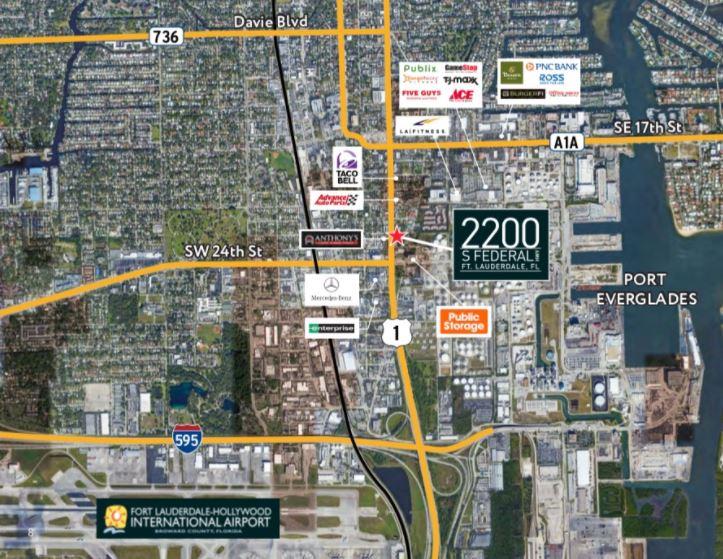
APEX Capital Realty is proud to present 2200 S Federal Hwy & 610 SE 22 ST (“The Properties”), a 3,010 SF prime retail building located near a signaled intersection at the highly trafficked S Federal Hwy in Ft. Lauderdale. The offering also includes a 740 SF office building with an ample paved parking area. The Properties sit on a 19,544 SF lot and is zoned B-1 BOULEVARD BUSINESS which allows a variety of uses including hotel, mixed-use, industrial, retail, automotive, and office. The Properties are prime for leasing of a retail user due to its ample parking area and direct visibility to over 55,500 vehicles per day. Currently there is a luxury used vehicle dealership occupying the space which is on a month to month lease.
Property Summary
BUILDING SIZE: 2200 Building: 3,010 SF
610 Building: 740 SF
TOTAL BUILDING AREA: 3,750 SF
LOT SIZE: 19,544 SF
CURRENT NOI: $120,000
TENANT: Exotic Motors (Luxury Used Car Dealer)
ZONING: B-1 – BOULEVARD BUSINESS
MAX BUILDABLE HEIGHT: 150 FT / 15 Stories
USES ALLOWED: Hotel, Mixed-use, Industrial, Retail, Automotive, Office
PARKING & CEILING HEIGHT: 25+ Spaces | 13? clear
ASKING PRICE: $2,950,000
TRAFFIC COUNTS (AADT): 55,500 VPD on S Federal HWY.
Property Highlights
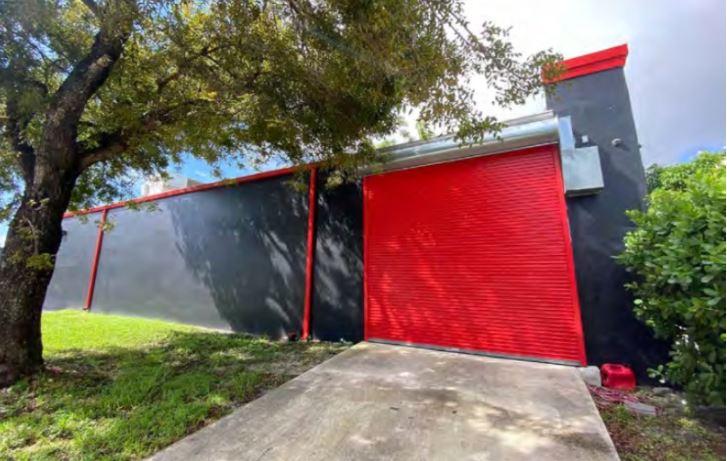
New aluminum fence and gate
New alarm and security system with cameras for both properties
New windows in both properties (not hurricane impact)
New sprinkler systems in both properties
Newer roof in 610 SE 22nd street (last 5 years)
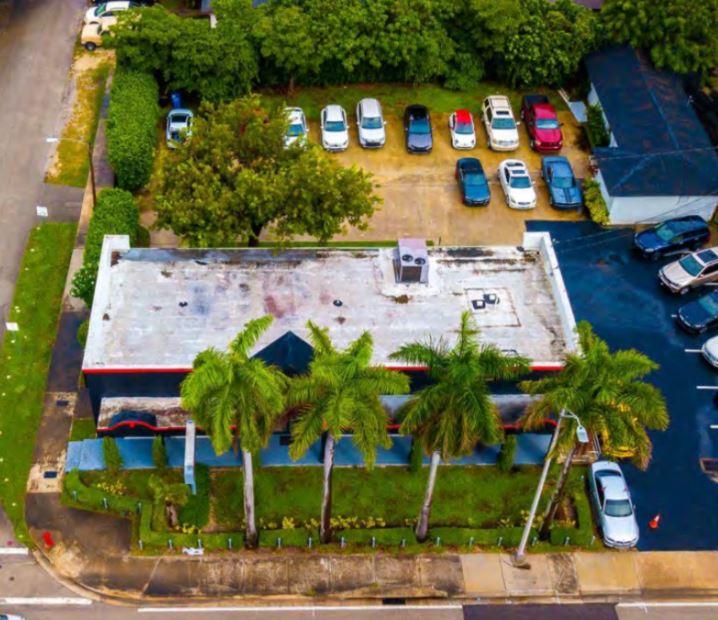
Owner estimates roof in larger structure is 10 years old
New bath, new kitchen, new floors and new HVAC in 610 SE 22nd street
New bath and new HVAC in 2200 S. Federal Highway
Asphalt portion of parking lot was re-finished with black top in late September 2020
Larger cement portion of parking lot (11k Sq ft) was refinished in the last 3 years
All renovations were performed with permits by Coastal construction. Owner can provide these