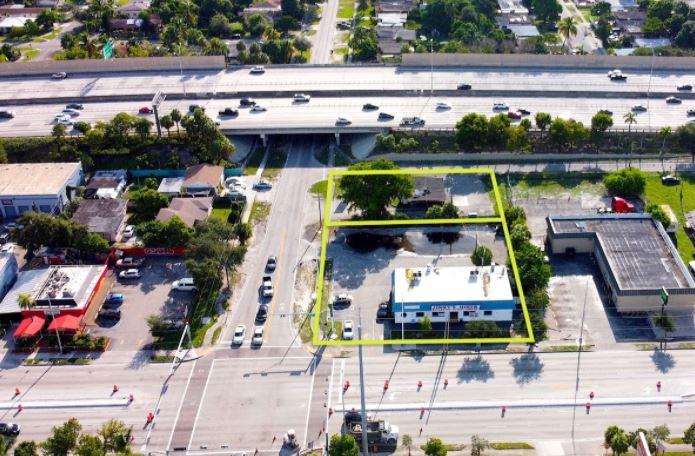
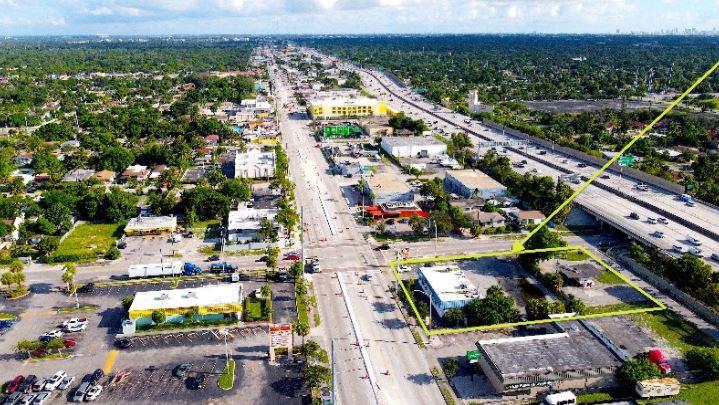
APEX Capital Realty is proud to present a unique assemblage opportunity featuring two retail tenants with food & beverage / convenience concepts at a hard corner at the intersection of NW 7th Avenue and NW 111th Street, between the Pinewood/Miami Shores neighborhoods of urban core Miami.
Property Summary
Total Assemblage Size: 29,120 Land SF (0.67 acres)
11045 NW 7 Ave: 19,370 Land SF
660 NW 111th St: 9,750 Land SF
Total Building Area: 4,004 SF (across 2 freestanding buildings)
Lease Types: NNN
NOI: $117,341
Zoning: UC-MC (UC-Center Mixed-Use Corridor)
Max. Height: 6 stories
Density: 36 units per acre (24 units on this site)
Dimensions: 130? x 223? approx.
COMBINED ASKING PRICE: $2,190,000 (5.4% CAP)
Property Highlights
Income-producing w/ 2 different tenants; the two property owners have come together to present the properties as an assemblage for the first time
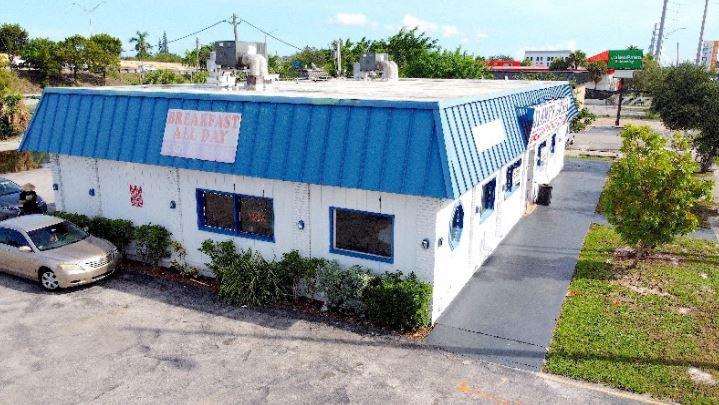
The approximately 3,222 SF fully-operating corner retail building is a 2nd generation kitchen w/ updated grease traps. Occupied by local “Jimmy’s Diner” restaurant tenant, the lease is NNN & carries a double-backed personal guarantee.
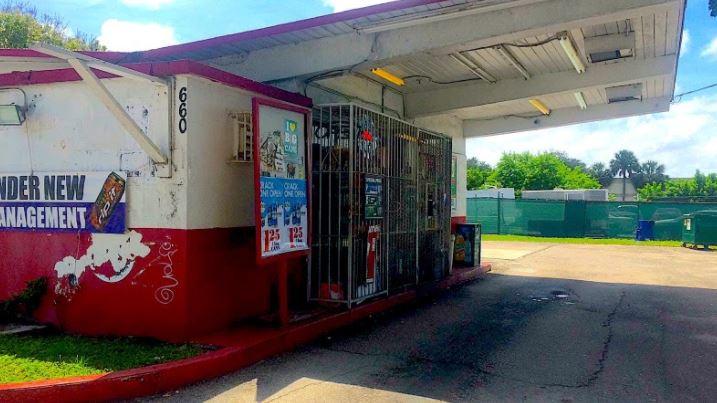
On the adjacent parcel sits an innovative drive-thru micro-convenience store concept which is currently owner-operated. Upon a sale, the owner will commit to a sale-leaseback agreement w/ terms flexible to the Buyer.
The surrounding area of this mixed-use high-traffic corridor is populated by both local and national tenants alike who enjoy the 37,000+ daily vehicles per day, not including the exposure from passersby on I-95, which runs just parallel to NW 7th Ave
All information based on the most recently available data (updated annually) and is provided in 1-mile, 3-mile, and 5-mile radii (radiuses) of the property location.
1-Mile | 3-Miles | 5-Miles | ||
---|---|---|---|---|
Total Population | 27,416 | 203,404 | 488,034 | |
Population Median Age | 37 | 37 | 38 | |
Population by Age | 0-9 Yrs | 3532 (12%) | 27758 (13%) | 61898 (12%) |
10-19 Yrs | 3753 (13%) | 25407 (12%) | 58459 (11%) | |
20-29 Yrs | 4478 (16%) | 30130 (14%) | 71727 (14%) | |
30-39 Yrs | 4077 (14%) | 28183 (13%) | 67422 (13%) | |
40-49 Yrs | 3296 (12%) | 25330 (12%) | 64704 (13%) | |
50-59 Yrs | 3333 (12%) | 27695 (13%) | 65947 (13%) | |
60-69 Yrs | 2567 (9%) | 21183 (10%) | 49415 (10%) | |
70+ Yrs | 2379 (8%) | 17719 (8%) | 48463 (9%) | |
Median HH Income | $38,867 | $35,986 | $36,767 | |
Total Household Income | < 24K | 2185 (31%) | 22554 (36%) | 53357 (35%) |
25-49K | 2002 (28%) | 17104 (27%) | 40392 (27%) | |
50-74K | 1329 (19%) | 9673 (15%) | 24389 (16%) | |
75-99K | 634 (9%) | 5200 (8%) | 12765 (8%) | |
100-199K | 639 (9%) | 5853 (9%) | 14441 (9%) | |
200K+ | 126 (1%) | 1461 (2%) | 4103 (2%) | |
Highest Education Level | No Diploma | 4363 | 33533 | 82859 |
Diploma or GED | 6317 | 44325 | 108424 | |
Some College | 2928 | 21987 | 53649 | |
Assoc. Degree | 1766 | 11458 | 27510 | |
Bachelors Degree | 1786 | 16305 | 41045 | |
Higher Degree | 575 | 7920 | 19944 | |
Total Housing Units | 7,542 | 68,907 | 168,069 | |
--Owner-Occupied | 3,458 | 27,218 | 66,193 | |
--Renter-Occupied | 3,458 | 34,627 | 83,253 | |
Owner-Occupied Values | < 100K | 503 | 4953 | 10771 |
100-199K | 1495 | 9439 | 23234 | |
200-299K | 773 | 5902 | 16864 | |
300-399K | 287 | 2930 | 6342 | |
400-499K | 234 | 1330 | 2489 | |
500K+ | 166 | 2664 | 6493 | |
Total Working Age Population | 21,883 | 160,499 | 391,239 | |
In Work Force | 13,412 | 98,888 | 237,670 | |
Not In Work Force | 8,472 | 61,611 | 153,568 | |
Workforce Employed | 11,902 | 88,330 | 214,207 | |
Workforce Unemployed | 1,502 | 10,518 | 23,378 | |
Civlian Workforce | 13,404 | 98,848 | 237,585 | |
Military Workforce | 8 | 40 | 85 | |
Total Households | 6,915 | 61,846 | 149,447 | |
Family Households | 5,165 | 40,741 | 97,586 | |
Non-Family Households | 1,750 | 21,104 | 51,861 | |
Married Couple | 2,553 | 19,888 | 49,492 | |
Other Family | 2,612 | 20,853 | 48,094 | |
Married w/Child | 926 | 7,919 | 19,103 | |
Single Male w/Child | 345 | 2,100 | 4,333 | |
Single Female w/Child | 771 | 7,369 | 16,812 |
Population Change Last Two Decades - Plus Projection
2000 | % | 2010 | % | 2020 | % | 2030 | |
---|---|---|---|---|---|---|---|
Florida | 15,982,378 | +18 | 18,801,310 | +14 | 21,517,610 | +13 | 24,340,457 |
Miami-Dade County | 2,253,362 | +11 | 2,496,435 | +15 | 2,861,579 | +11 | 3,190,242 |
No part of this information may be copied, reproduced, repurposed, or screen-captured for any commercial purpose without prior written authorization from MyEListing.
While we strive to provide the most accurate information, all listing information, and demographic data, is provided by third-parties. As such, MyEListing will not be responsible for the accuracy of the information. It is strongly recommended that you verify all information with the listing agent, and any relevant agencies, prior to making any decisions.