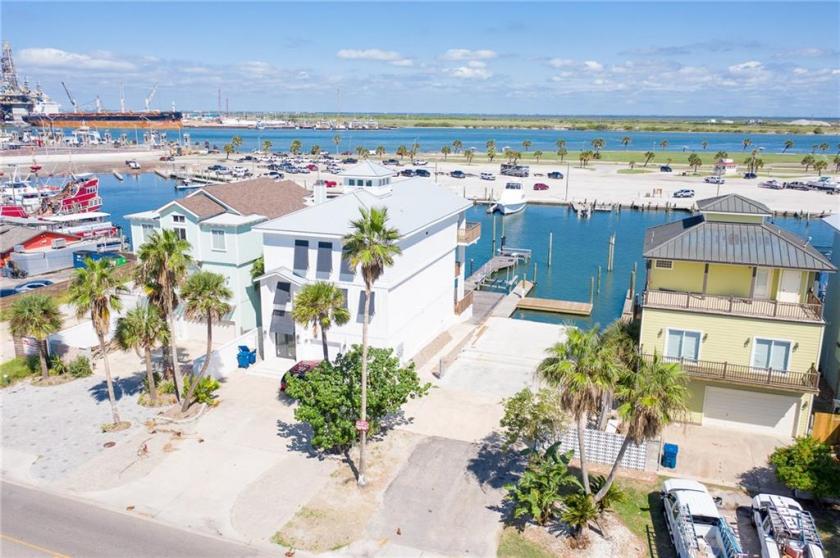
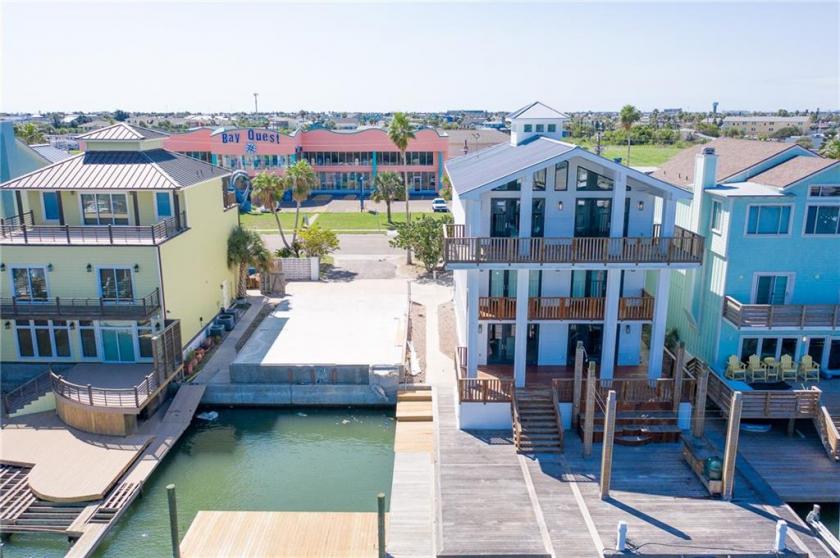
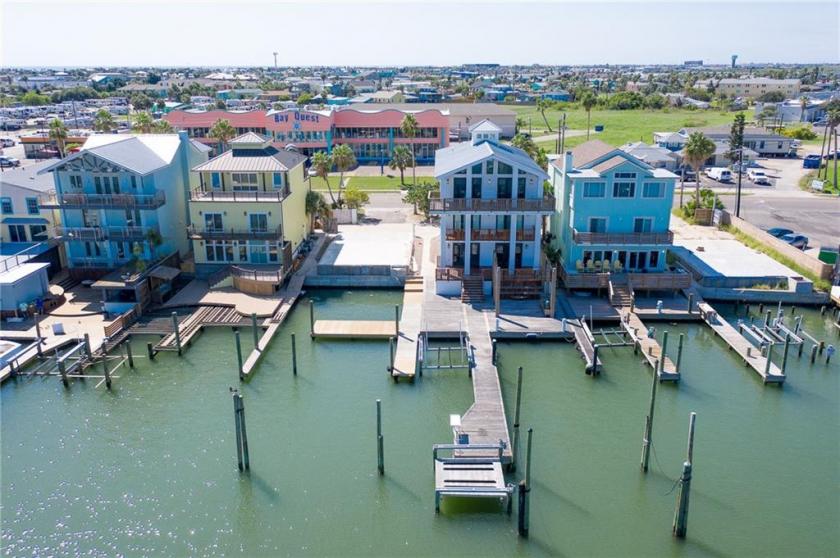
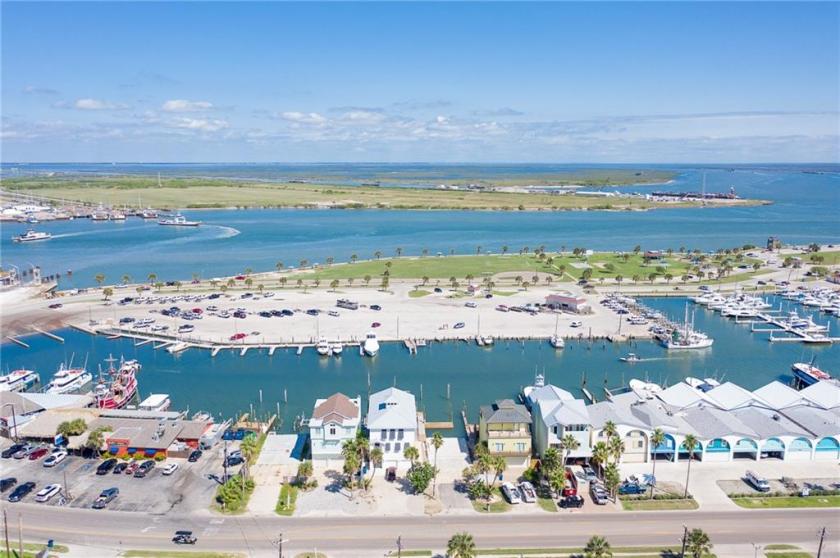
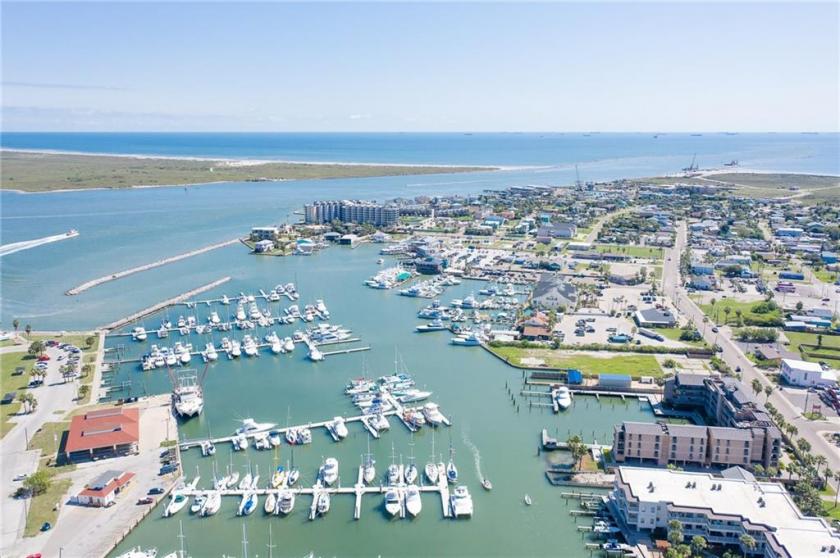
1-Mile | 3-Miles | 5-Miles | ||
---|---|---|---|---|
Total Population | 1,278 | 3,856 | 4,446 | |
Population Median Age | 44 | 45 | 45 | |
Population by Age | 0-9 Yrs | 50 (3%) | 235 (6%) | 279 (6%) |
10-19 Yrs | 153 (11%) | 345 (8%) | 416 (9%) | |
20-29 Yrs | 191 (14%) | 556 (14%) | 634 (14%) | |
30-39 Yrs | 97 (7%) | 324 (8%) | 375 (8%) | |
40-49 Yrs | 162 (12%) | 480 (12%) | 532 (11%) | |
50-59 Yrs | 303 (23%) | 950 (24%) | 1057 (23%) | |
60-69 Yrs | 194 (15%) | 510 (13%) | 628 (14%) | |
70+ Yrs | 128 (10%) | 454 (11%) | 524 (11%) | |
Median HH Income | $44,448 | $53,087 | $53,526 | |
Total Household Income | < 24K | 149 (24%) | 395 (21%) | 451 (21%) |
25-49K | 167 (27%) | 467 (25%) | 517 (24%) | |
50-74K | 76 (12%) | 356 (19%) | 426 (20%) | |
75-99K | 51 (8%) | 185 (9%) | 203 (9%) | |
100-199K | 125 (20%) | 382 (20%) | 430 (20%) | |
200K+ | 37 (6%) | 78 (4%) | 91 (4%) | |
Highest Education Level | No Diploma | 50 | 117 | 157 |
Diploma or GED | 326 | 867 | 951 | |
Some College | 193 | 670 | 817 | |
Assoc. Degree | 51 | 223 | 254 | |
Bachelors Degree | 227 | 681 | 763 | |
Higher Degree | 100 | 343 | 398 | |
Total Housing Units | 1,494 | 4,427 | 4,960 | |
--Owner-Occupied | 322 | 1,077 | 1,246 | |
--Renter-Occupied | 283 | 786 | 872 | |
Owner-Occupied Values | < 100K | 46 | 88 | 139 |
100-199K | 57 | 255 | 285 | |
200-299K | 55 | 205 | 243 | |
300-399K | 100 | 322 | 340 | |
400-499K | 26 | 66 | 70 | |
500K+ | 37 | 141 | 169 | |
Total Working Age Population | 1,155 | 3,474 | 3,973 | |
In Work Force | 719 | 2,217 | 2,503 | |
Not In Work Force | 436 | 1,257 | 1,470 | |
Workforce Employed | 678 | 2,081 | 2,354 | |
Workforce Unemployed | 37 | 101 | 111 | |
Civlian Workforce | 715 | 2,183 | 2,465 | |
Military Workforce | 4 | 35 | 38 | |
Total Households | 605 | 1,863 | 2,118 | |
Family Households | 358 | 1,112 | 1,273 | |
Non-Family Households | 247 | 751 | 845 | |
Married Couple | 249 | 818 | 948 | |
Other Family | 109 | 294 | 325 | |
Married w/Child | 61 | 190 | 222 | |
Single Male w/Child | 34 | 56 | 62 | |
Single Female w/Child | 35 | 123 | 138 |
Population Change Last Two Decades - Plus Projection
2000 | % | 2010 | % | 2020 | % | 2030 | |
---|---|---|---|---|---|---|---|
Texas | 20,851,820 | +21 | 25,145,561 | +18 | 29,677,668 | +18 | 34,894,452 |
Nueces County | 313,645 | +8 | 340,223 | +13 | 383,718 | +12 | 429,517 |
Aransas County | 22,497 | +3 | 23,158 | +20 | 27,699 | +20 | 33,123 |
Total Working Age Population:
Total Households:
Total Working Age Population:
Total Households:
Total Working Age Population:
Total Households: