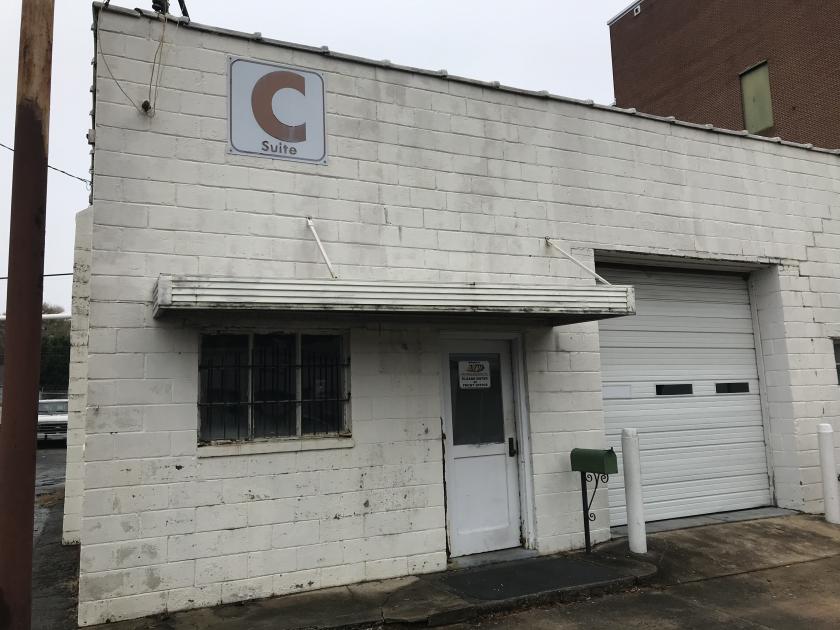
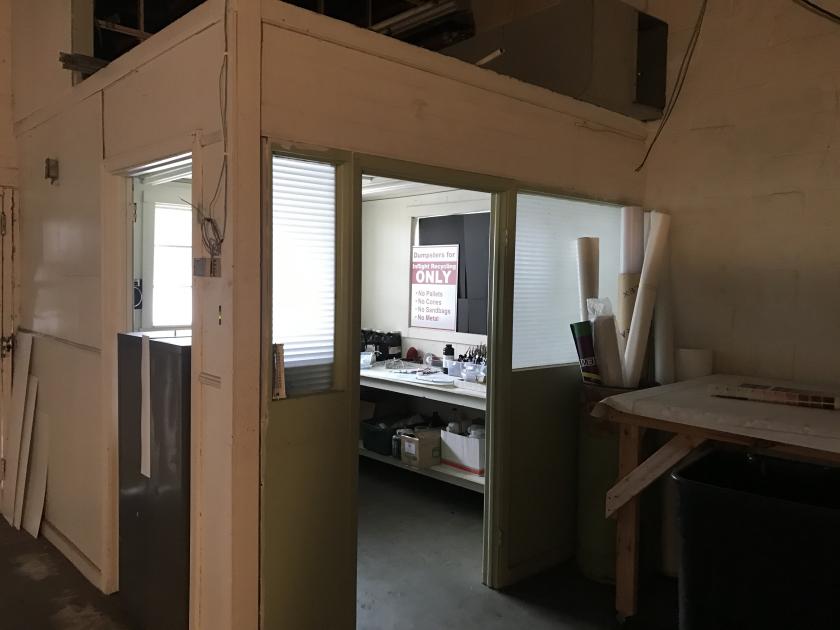
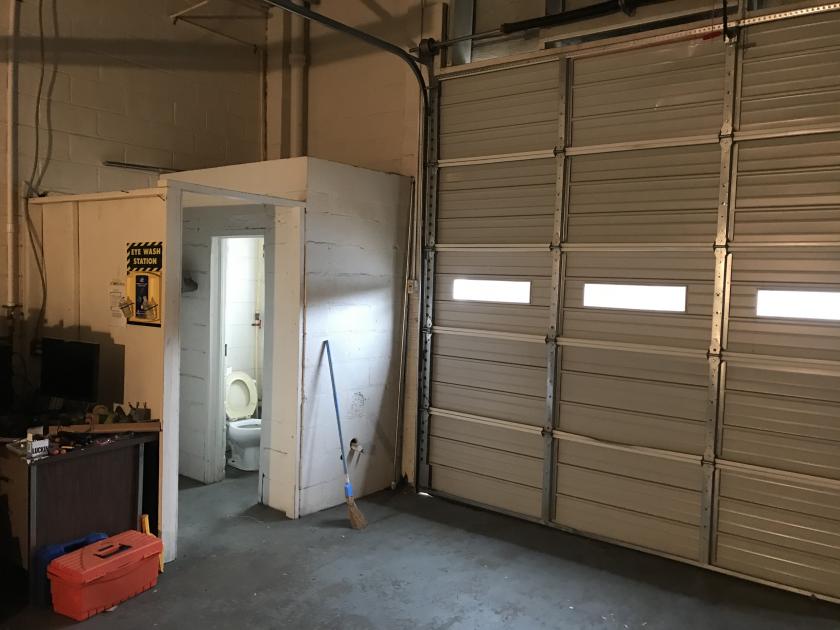
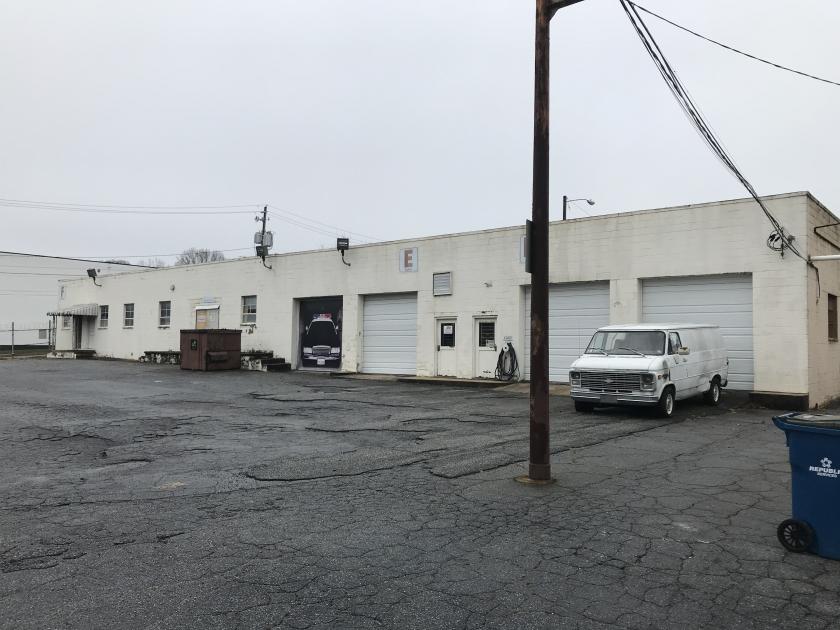
1-Mile | 3-Miles | 5-Miles | ||
---|---|---|---|---|
Total Population | 9,748 | 67,492 | 175,655 | |
Population Median Age | 37 | 37 | 36 | |
Population by Age | 0-9 Yrs | 1135 (11%) | 9044 (13%) | 24887 (14%) |
10-19 Yrs | 1196 (12%) | 8819 (13%) | 22482 (12%) | |
20-29 Yrs | 1398 (14%) | 10743 (15%) | 27485 (15%) | |
30-39 Yrs | 1490 (15%) | 9873 (14%) | 26393 (15%) | |
40-49 Yrs | 1432 (14%) | 7781 (11%) | 21352 (12%) | |
50-59 Yrs | 1438 (14%) | 8374 (12%) | 21404 (12%) | |
60-69 Yrs | 1112 (11%) | 7726 (11%) | 17955 (10%) | |
70+ Yrs | 548 (5%) | 5132 (7%) | 13698 (7%) | |
Median HH Income | $42,323 | $33,248 | $34,252 | |
Total Household Income | < 24K | 1230 (32%) | 10358 (38%) | 25251 (37%) |
25-49K | 929 (24%) | 7637 (28%) | 19711 (29%) | |
50-74K | 735 (19%) | 4208 (15%) | 10546 (15%) | |
75-99K | 294 (7%) | 2185 (8%) | 5482 (8%) | |
100-199K | 507 (13%) | 2313 (8%) | 5785 (8%) | |
200K+ | 131 (3%) | 350 (1%) | 996 (1%) | |
Highest Education Level | No Diploma | 963 | 6841 | 18294 |
Diploma or GED | 2371 | 14441 | 37704 | |
Some College | 1223 | 9663 | 25514 | |
Assoc. Degree | 521 | 3626 | 9159 | |
Bachelors Degree | 1264 | 7077 | 16281 | |
Higher Degree | 690 | 3746 | 9333 | |
Total Housing Units | 5,088 | 33,766 | 84,841 | |
--Owner-Occupied | 1,524 | 9,400 | 24,474 | |
--Renter-Occupied | 2,302 | 17,651 | 43,298 | |
Owner-Occupied Values | < 100K | 555 | 3941 | 10672 |
100-199K | 471 | 3683 | 9265 | |
200-299K | 266 | 1180 | 2966 | |
300-399K | 111 | 324 | 929 | |
400-499K | 51 | 92 | 237 | |
500K+ | 71 | 180 | 404 | |
Total Working Age Population | 7,776 | 52,542 | 136,236 | |
In Work Force | 5,314 | 33,589 | 85,675 | |
Not In Work Force | 2,462 | 18,953 | 50,561 | |
Workforce Employed | 4,847 | 29,837 | 75,599 | |
Workforce Unemployed | 467 | 3,676 | 9,921 | |
Civlian Workforce | 5,314 | 33,514 | 85,520 | |
Military Workforce | 0 | 75 | 155 | |
Total Households | 3,826 | 27,052 | 67,772 | |
Family Households | 1,895 | 12,846 | 34,433 | |
Non-Family Households | 1,931 | 14,206 | 33,339 | |
Married Couple | 1,083 | 5,234 | 12,443 | |
Other Family | 811 | 7,612 | 21,990 | |
Married w/Child | 488 | 1,887 | 4,216 | |
Single Male w/Child | 54 | 460 | 1,475 | |
Single Female w/Child | 320 | 3,196 | 9,188 |
Population Change Last Two Decades - Plus Projection
2000 | % | 2010 | % | 2020 | % | 2030 | |
---|---|---|---|---|---|---|---|
Georgia | 8,186,453 | +18 | 9,687,653 | +10 | 10,694,980 | +9 | 11,709,700 |
Fulton County | 816,006 | +13 | 920,581 | +17 | 1,074,154 | +11 | 1,186,980 |
Clayton County | 236,517 | +10 | 259,424 | +15 | 299,477 | +17 | 349,752 |
Total Working Age Population:
Total Households:
Total Working Age Population:
Total Households:
Total Working Age Population:
Total Households: