Specialty Real Estate
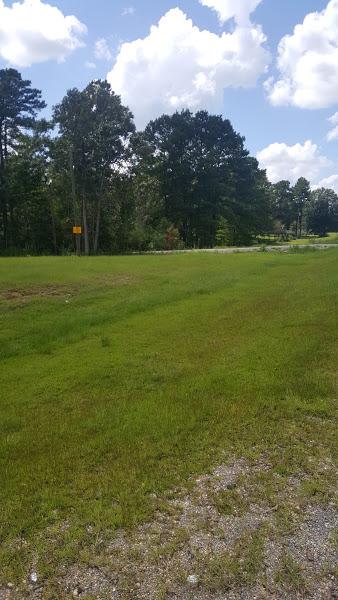
41969 Louisiana 16 Pine Grove, LA 70453
41969 Louisiana 16 Pine Grove, LA 70453

Details & Description
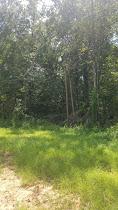
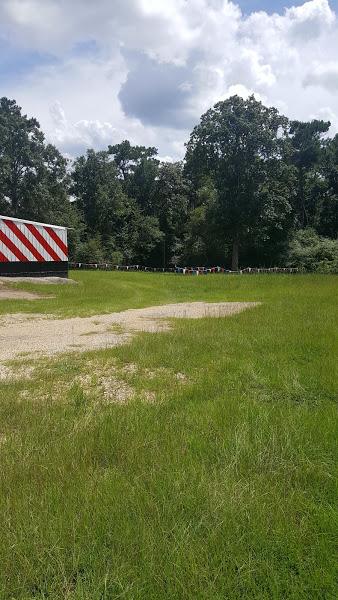
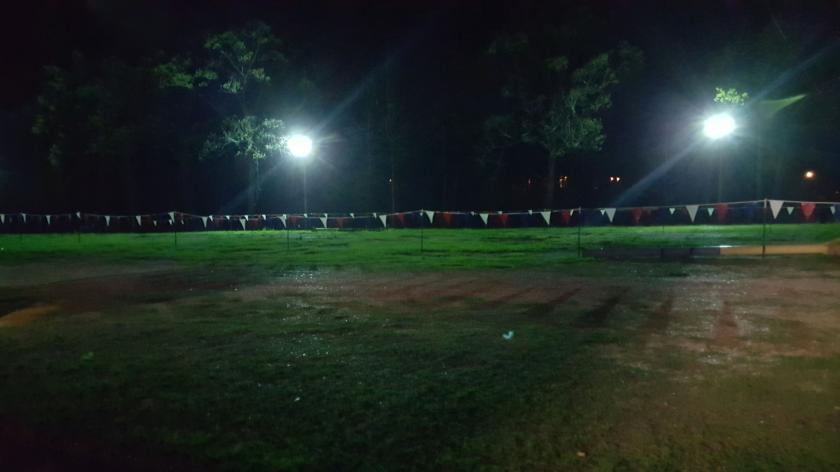
Additional Photos


Listing Agents

Alvin Cain
O: 225-384-0020
M: 225-993-0827
alvin@acg-realty.com
O: 225-384-0020
M: 225-993-0827
alvin@acg-realty.com
While we strive to provide the most accurate information, all listing information, and demographic data, is provided by third-parties. As such, MyEListing will not be responsible for the accuracy of the information. It is strongly recommended that you verify all information with the listing agent, and any relevant agencies, prior to making any decisions.