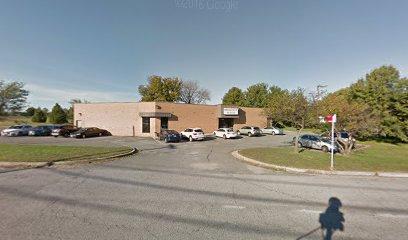
List 5 units in a Medical Office building - units for rent
- 4333 Old Branch Avenue, Temple Hills MD 20748
- Partly Furnished
- Option to share or Daily Usage
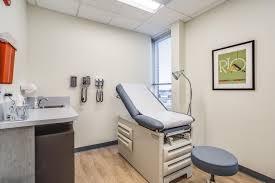
1. - Suite A - 5 Exam rooms
- 2 Medical Office Rooms
- One toilet
- One Nurse Station
$5,500 /month
2. Suite B - Occupied
3. Suite C - 3 Exam Rooms
- 1 Medical Office
- 1 Nurse station and lab area
- 1 toilet
$4,000
4. - Suite D - 3 Exam rooms
- 3 Medical Office Rooms
- One toilet
- One Nurse Station
$4,500 /month
5. Suite E - Waiting Room Area R
- 2 Large Diagnostic and procedure Rooms
- 1 toilet
$3,800
Contact me reply to this Email
Dan Austin
or call 301-4234551
No part of this information may be copied, reproduced, repurposed, or screen-captured for any commercial purpose without prior written authorization from MyEListing.
While we strive to provide the most accurate information, all listing information, and demographic data, is provided by third-parties. As such, MyEListing will not be responsible for the accuracy of the information. It is strongly recommended that you verify all information with the listing agent, and any relevant agencies, prior to making any decisions.
What is the asking price for 4333 Old Branch Avenue in Temple Hills?
The asking price for 4333 Old Branch Avenue is $14.00 a SF per Year
What is the building size of this commercial Office property?
The size of this lease property at '.4333 Old Branch Avenue.' is 10000 square feet
What is the population within 1 mile of 4333 Old Branch Avenue in Temple Hills?
The population within 1 mile of 4333 Old Branch Avenue Temple Hills, MD 20748 is 14,334 people.
Who do I contact for questions about 4333 Old Branch Avenue?
You should contact the listing agent,
Dan Austin, for any details regarding this commercial listing.