Retail Space
4400 Bourbon Street Frisco, TX 75034
4400 Bourbon Street Frisco, TX 75034
Details & Description
Property Highlights
- • Anchored by Dreamland Preschool
- • First HEB in DFW Located Less Than a Mile Away
- • Dreamland Preschool Scheduled to Open Summer 2023
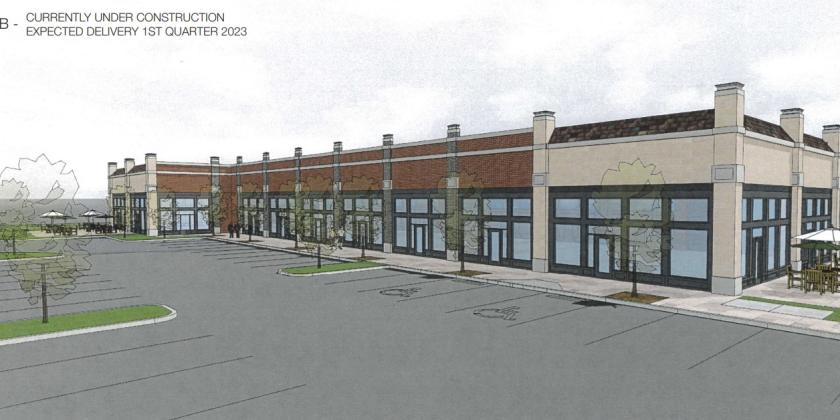
- • Building B End Caps with Patio and Grease Traps
Additional Photos
Listing Agents

Josh Mann
O: 214-256-7100
M: 972-971-8336
jmann@nairl.com
O: 214-256-7100
M: 972-971-8336
jmann@nairl.com

Ari Mann
O: 214-256-7181
amann@nairl.com
O: 214-256-7181
amann@nairl.com
While we strive to provide the most accurate information, all listing information, and demographic data, is provided by third-parties. As such, MyEListing will not be responsible for the accuracy of the information. It is strongly recommended that you verify all information with the listing agent, and any relevant agencies, prior to making any decisions.


