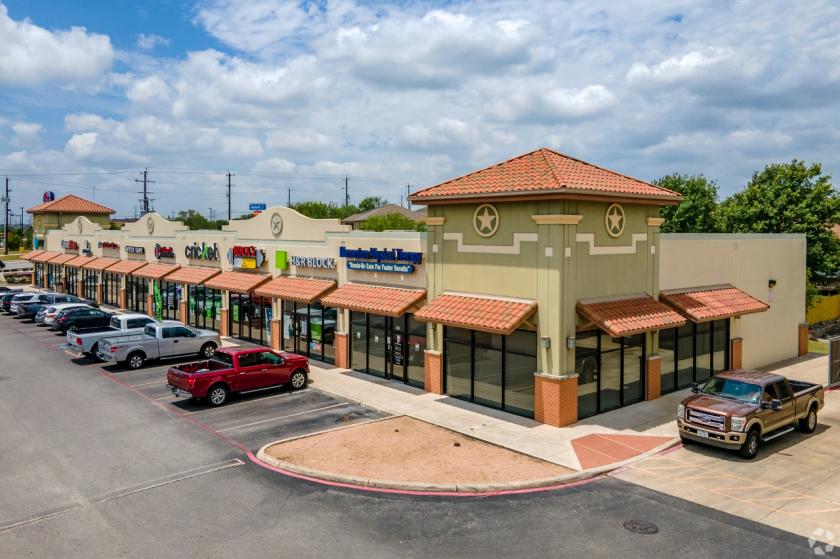
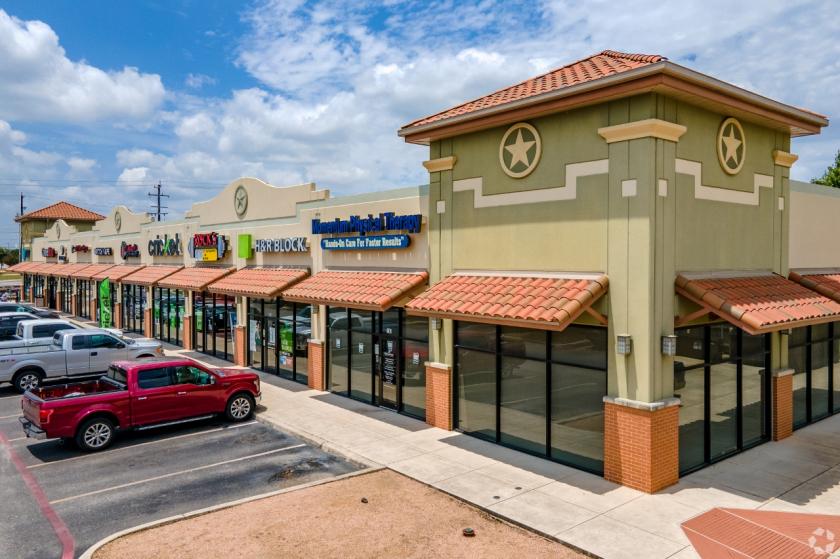
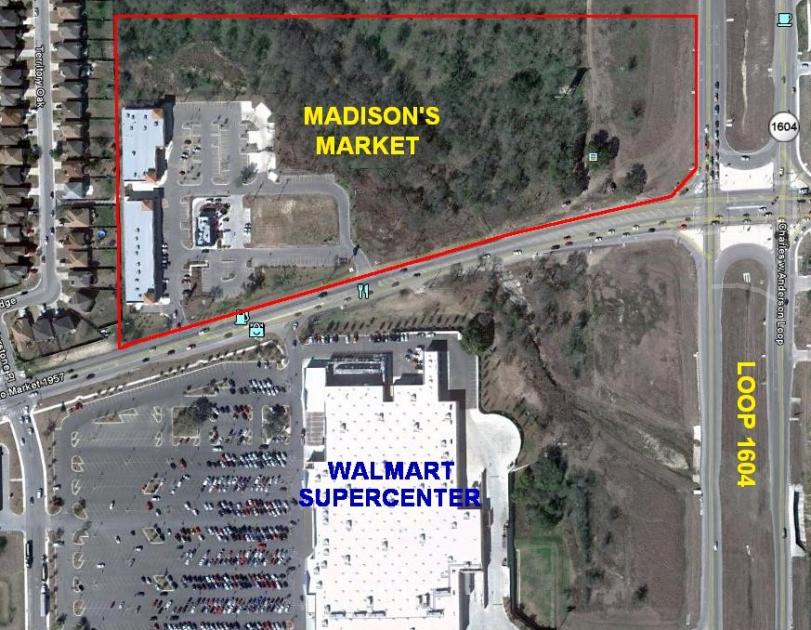
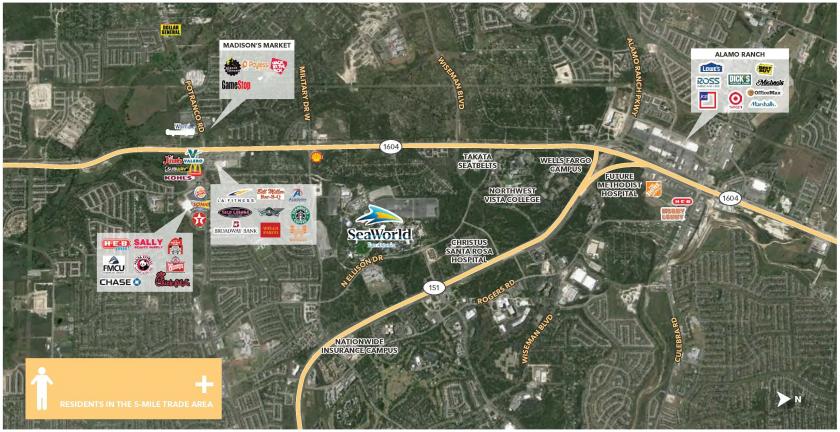
1-Mile | 3-Miles | 5-Miles | ||
---|---|---|---|---|
Total Population | 13,076 | 81,117 | 206,077 | |
Population Median Age | 32 | 32 | 33 | |
Population by Age | 0-9 Yrs | 2172 (16%) | 13888 (17%) | 34445 (16%) |
10-19 Yrs | 2326 (17%) | 13012 (16%) | 30818 (14%) | |
20-29 Yrs | 1534 (11%) | 12321 (15%) | 33832 (16%) | |
30-39 Yrs | 2236 (17%) | 13829 (17%) | 34084 (16%) | |
40-49 Yrs | 1943 (14%) | 10754 (13%) | 26873 (13%) | |
50-59 Yrs | 1443 (11%) | 8205 (10%) | 21298 (10%) | |
60-69 Yrs | 876 (6%) | 5505 (6%) | 14371 (6%) | |
70+ Yrs | 546 (4%) | 3602 (4%) | 10355 (5%) | |
Median HH Income | $89,568 | $78,256 | $67,942 | |
Total Household Income | < 24K | 256 (6%) | 2091 (8%) | 8078 (13%) |
25-49K | 429 (11%) | 4110 (17%) | 13352 (21%) | |
50-74K | 739 (19%) | 5106 (21%) | 13356 (21%) | |
75-99K | 769 (20%) | 4351 (18%) | 9738 (15%) | |
100-199K | 1295 (34%) | 6837 (28%) | 15014 (24%) | |
200K+ | 256 (6%) | 1252 (5%) | 2383 (3%) | |
Highest Education Level | No Diploma | 615 | 4526 | 14420 |
Diploma or GED | 1582 | 10832 | 31416 | |
Some College | 1831 | 12589 | 32853 | |
Assoc. Degree | 1042 | 6364 | 14126 | |
Bachelors Degree | 1702 | 9173 | 21549 | |
Higher Degree | 994 | 5119 | 11229 | |
Total Housing Units | 3,946 | 25,124 | 65,892 | |
--Owner-Occupied | 3,058 | 16,928 | 41,122 | |
--Renter-Occupied | 686 | 6,820 | 20,799 | |
Owner-Occupied Values | < 100K | 157 | 2117 | 7673 |
100-199K | 1884 | 9880 | 21983 | |
200-299K | 816 | 3786 | 8243 | |
300-399K | 110 | 695 | 2341 | |
400-499K | 12 | 307 | 618 | |
500K+ | 79 | 143 | 263 | |
Total Working Age Population | 9,320 | 59,052 | 152,462 | |
In Work Force | 6,668 | 42,029 | 106,052 | |
Not In Work Force | 2,652 | 17,023 | 46,410 | |
Workforce Employed | 6,081 | 38,443 | 96,029 | |
Workforce Unemployed | 267 | 2,015 | 6,521 | |
Civlian Workforce | 6,348 | 40,459 | 102,550 | |
Military Workforce | 321 | 1,570 | 3,502 | |
Total Households | 3,744 | 23,748 | 61,921 | |
Family Households | 3,129 | 18,401 | 45,767 | |
Non-Family Households | 615 | 5,347 | 16,154 | |
Married Couple | 2,451 | 13,853 | 33,046 | |
Other Family | 678 | 4,548 | 12,721 | |
Married w/Child | 1,234 | 7,546 | 17,287 | |
Single Male w/Child | 114 | 748 | 1,624 | |
Single Female w/Child | 365 | 1,937 | 5,419 |
Population Change Last Two Decades - Plus Projection
2000 | % | 2010 | % | 2020 | % | 2030 | |
---|---|---|---|---|---|---|---|
Texas | 20,851,820 | +21 | 25,145,561 | +18 | 29,677,668 | +18 | 34,894,452 |
Bexar County | 1,392,931 | +23 | 1,714,773 | +22 | 2,093,502 | +20 | 2,502,617 |
Total Working Age Population:
Total Households:
Total Working Age Population:
Total Households:
Total Working Age Population:
Total Households: