Description:
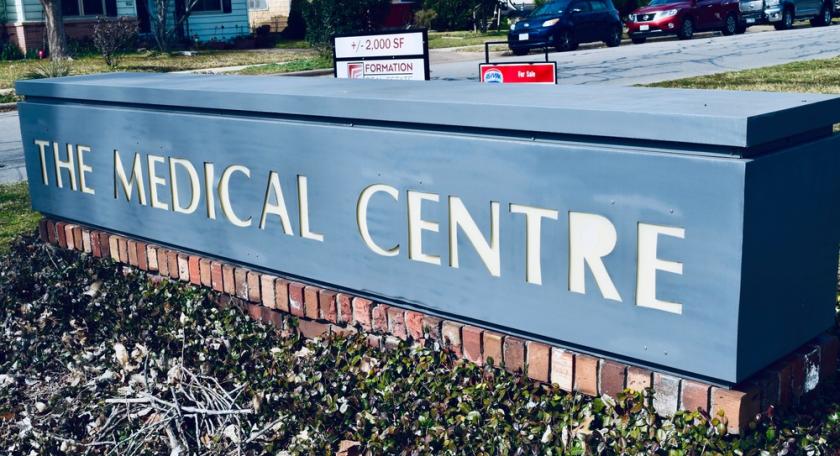
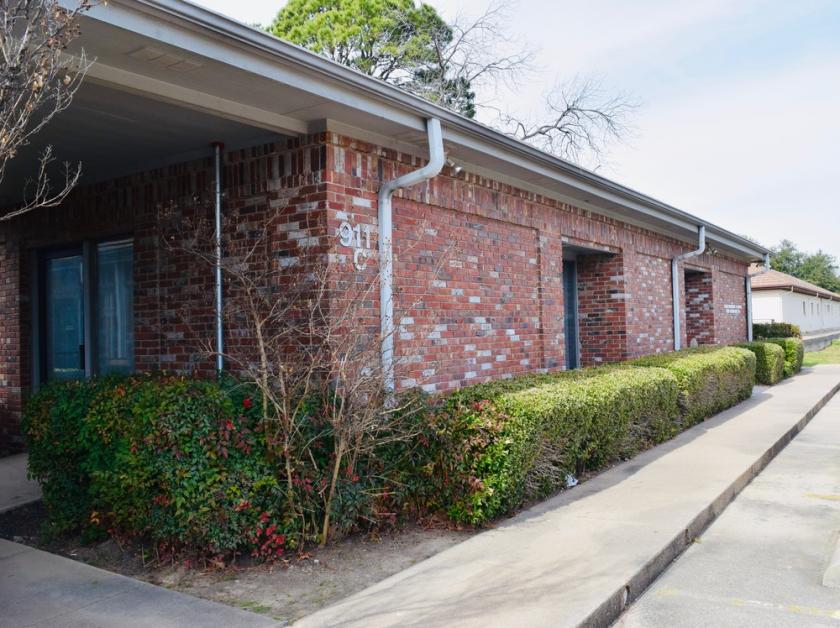
Office Space Available For Lease in North Arlington Medical District. Conveniently located in close proximity to Arlington's Entertainment District.
Area Amenities: AT&T Stadium, Globe Life Park in Arlington, Texas Live!, Champions Park, Six Flags & Hurricane Harbor.
Location:
NEQ of Medical Centre Dr / Magnolia St in North Arlington - Close proximity to Texas Health Arlington Memorial Hospital.
Highlights:
2019 OPEX: +/-$5.25
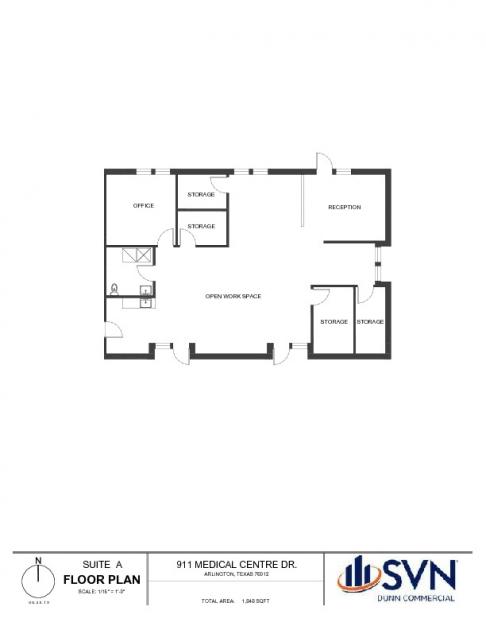
Open Floor Layout
Tenant Improvement Package Negotiable
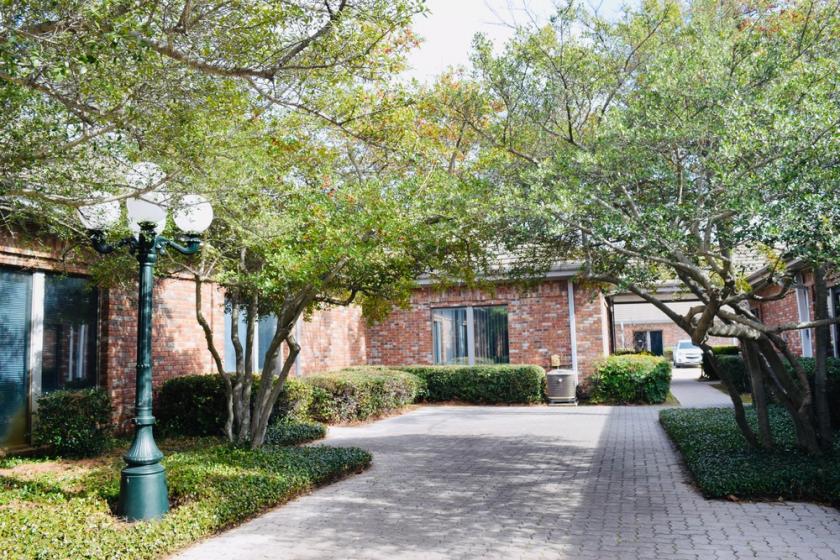
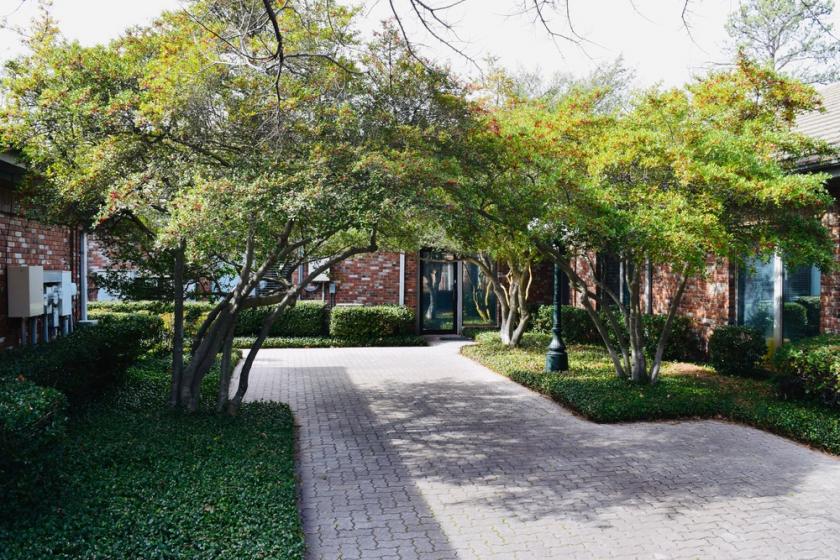
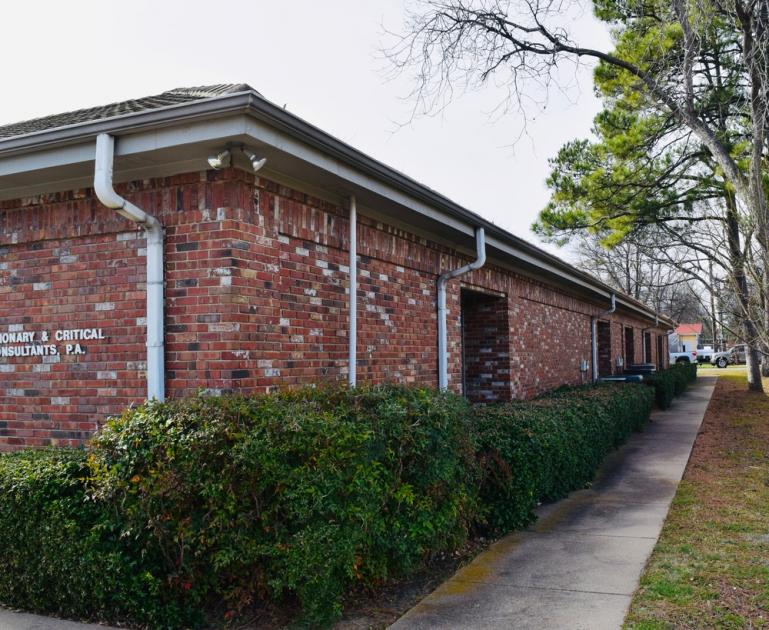
Direct Access to Space from Parking Lot
Walking Distance to Texas Health Arlington Memorial Hospital
Easy Access to IH-30, W Randol Mill Rd, N Cooper St, & N Davis Blvd
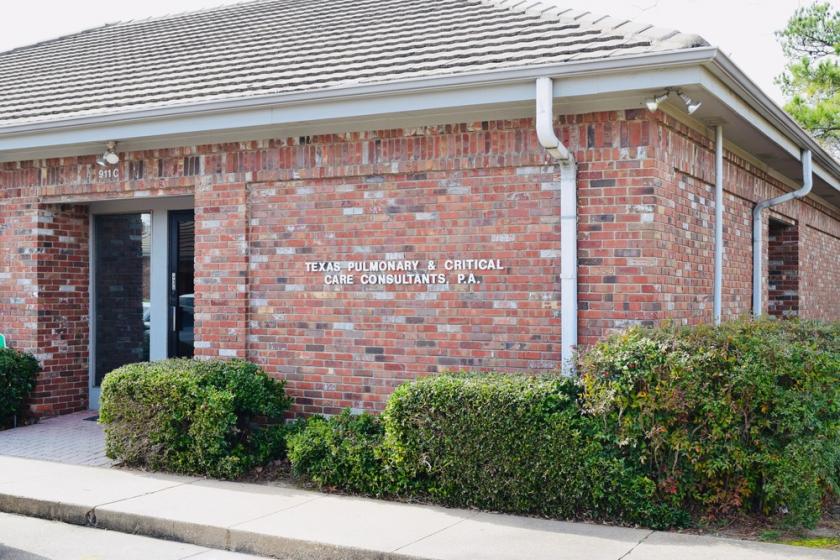
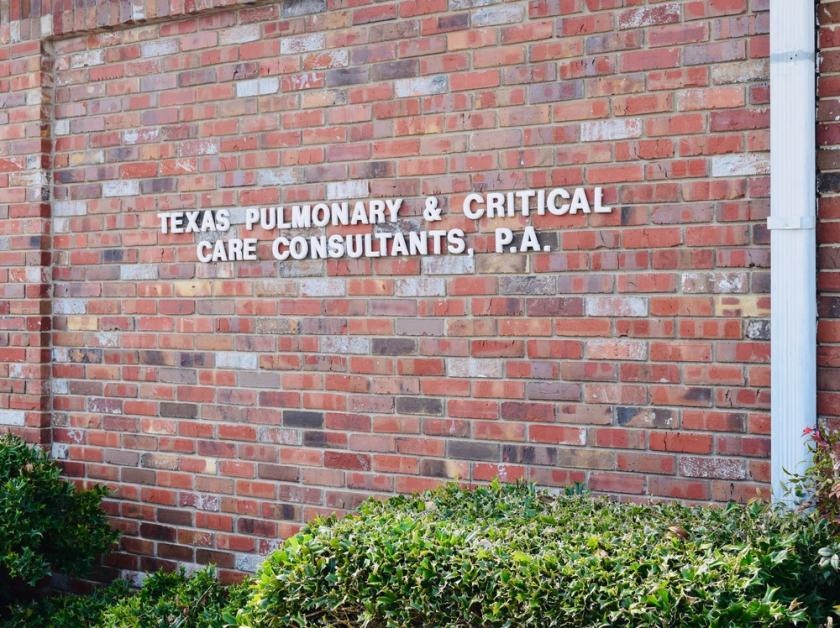
Immediate Neighboring Tenant - Texas Pulmonary & Critical Care Consultants, P.A.
No part of this information may be copied, reproduced, repurposed, or screen-captured for any commercial purpose without prior written authorization from MyEListing.
While we strive to provide the most accurate information, all listing information, and demographic data, is provided by third-parties. As such, MyEListing will not be responsible for the accuracy of the information. It is strongly recommended that you verify all information with the listing agent, and any relevant agencies, prior to making any decisions.
What is the asking price for 911 Medical Centre Drive in Arlington?
The asking price for 911 Medical Centre Drive is $12.00 a SF per Year
What is the building size of this commercial Office property?
The size of this lease property at '.911 Medical Centre Drive.' is 7561 square feet
What is the population within 1 mile of 911 Medical Centre Drive in Arlington?
The population within 1 mile of 911 Medical Centre Drive Arlington, TX 76012 is 13,804 people.
Who do I contact for questions about 911 Medical Centre Drive?
You should contact the listing agent,
Durban Rohrbach, for any details regarding this commercial listing.