Description:
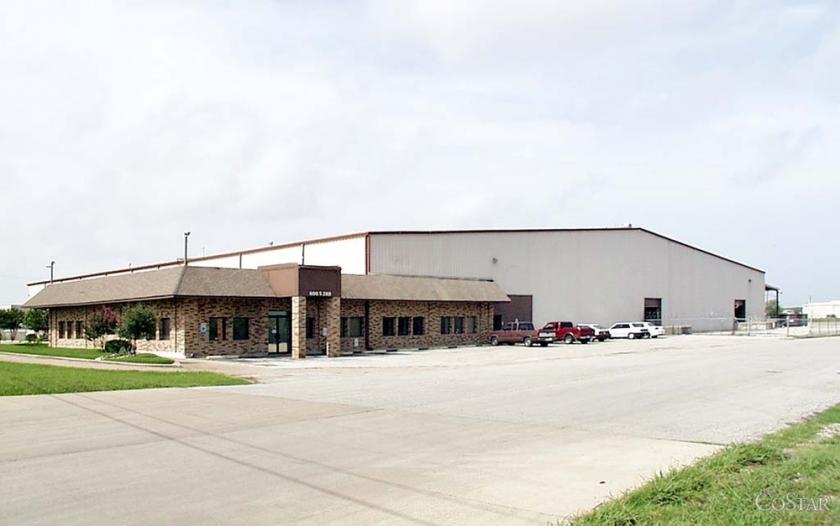
This Building is fully sprinklered and has a 32 ft clear height. It has Heavy Power, 10 Dock High Doors and 5 Grade Level Doors.
Location:
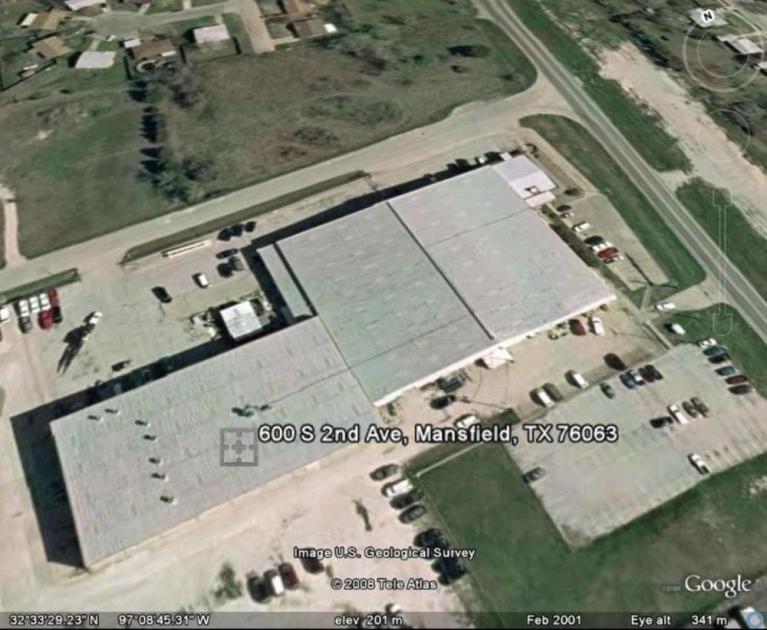
Located in South West Mansfield on West Farm Road 917 in the Mansfield Industrial Park, approximately 2 miles from Highway 287. Metal building with brick office front. Compressed air
throughout. The 9.2 acres of land is chained link fenced with a 2,300-square-foot air conditioned production area. Building has the structure in place for a crane.
Highlights:
Crane served
Excess Land for development
9.2 acres of land is chained link fenced
Government Contractor w/ Long History of success
1/4 mile from highway 157/ bus 287
2 miles from highway 287
Compressed air throughout
2,300-square-foot air conditioned production area
No part of this information may be copied, reproduced, repurposed, or screen-captured for any commercial purpose without prior written authorization from MyEListing.
While we strive to provide the most accurate information, all listing information, and demographic data, is provided by third-parties. As such, MyEListing will not be responsible for the accuracy of the information. It is strongly recommended that you verify all information with the listing agent, and any relevant agencies, prior to making any decisions.
What is the asking price for 600 South 2nd Avenue in Mansfield?
The asking price for 600 South 2nd Avenue is $4.25 a SF per Year
What is the building size of this commercial Industrial property?
The size of this lease property at '.600 South 2nd Avenue.' is 81154 square feet
What is the population within 1 mile of 600 South 2nd Avenue in Mansfield?
The population within 1 mile of 600 South 2nd Avenue Mansfield, TX 76063 is 3,342 people.
Who do I contact for questions about 600 South 2nd Avenue?
You should contact the listing agent,
Durban Rohrbach, for any details regarding this commercial listing.