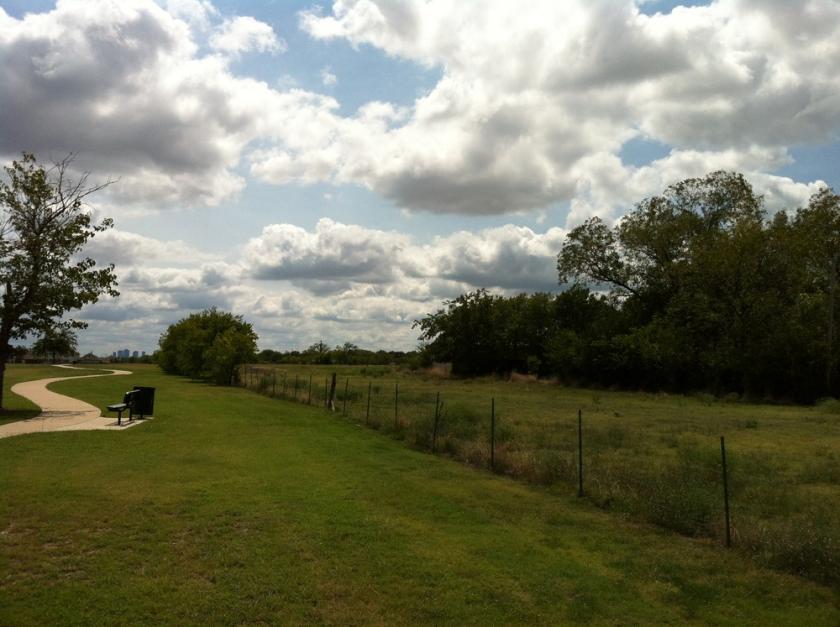
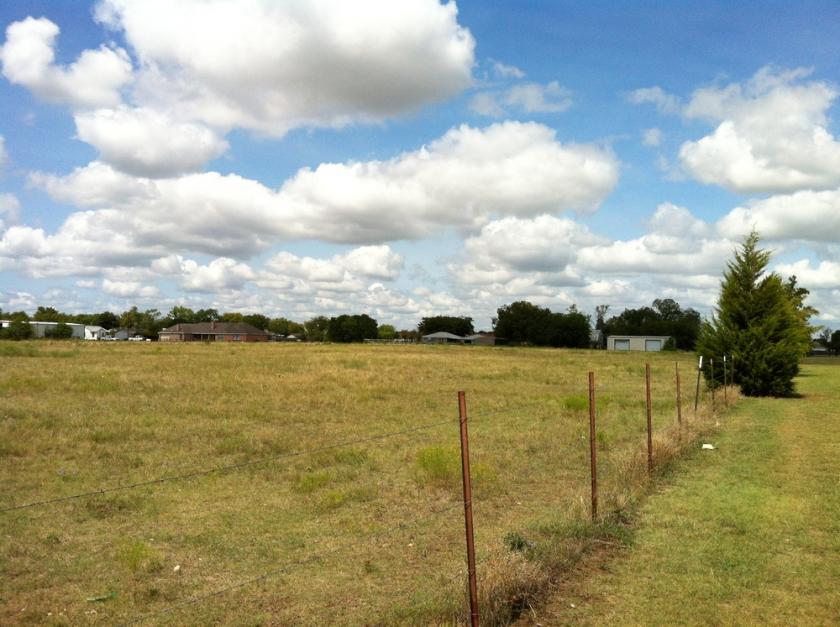
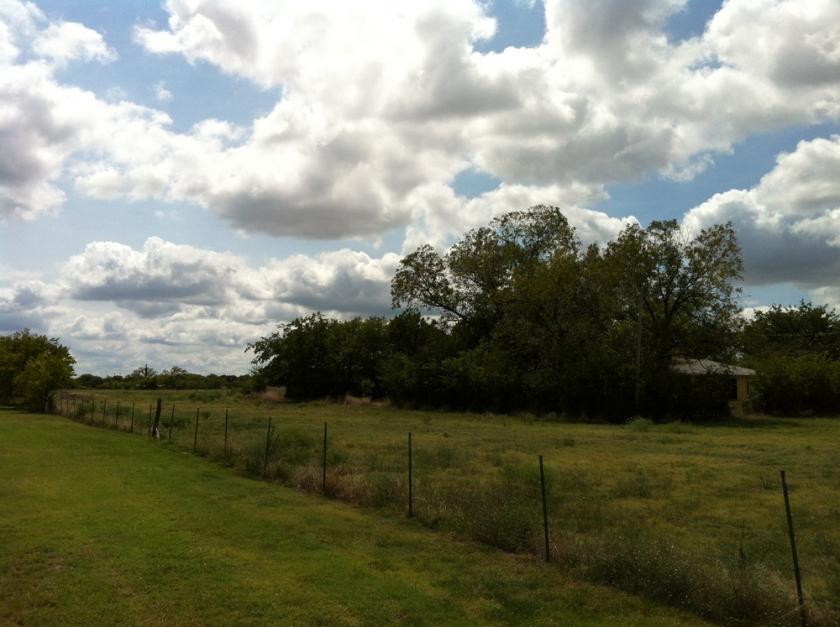
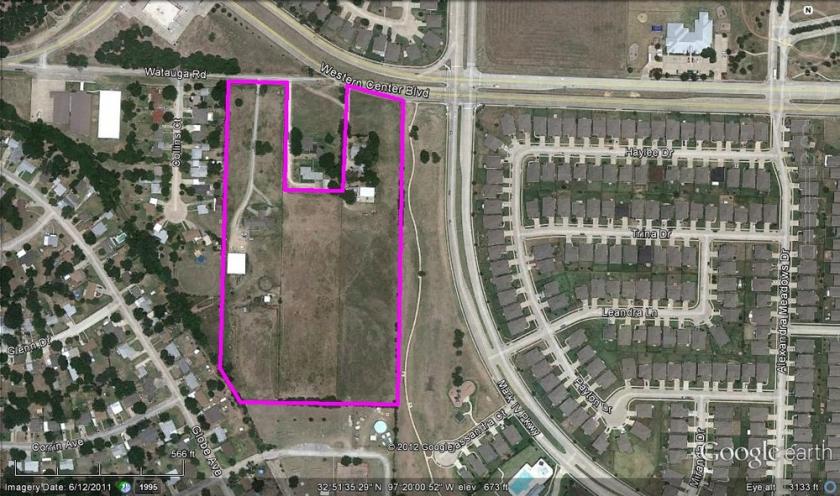
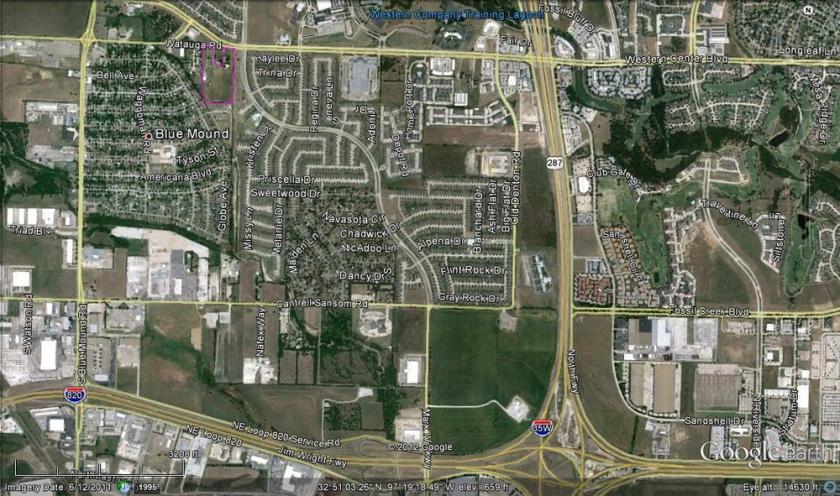
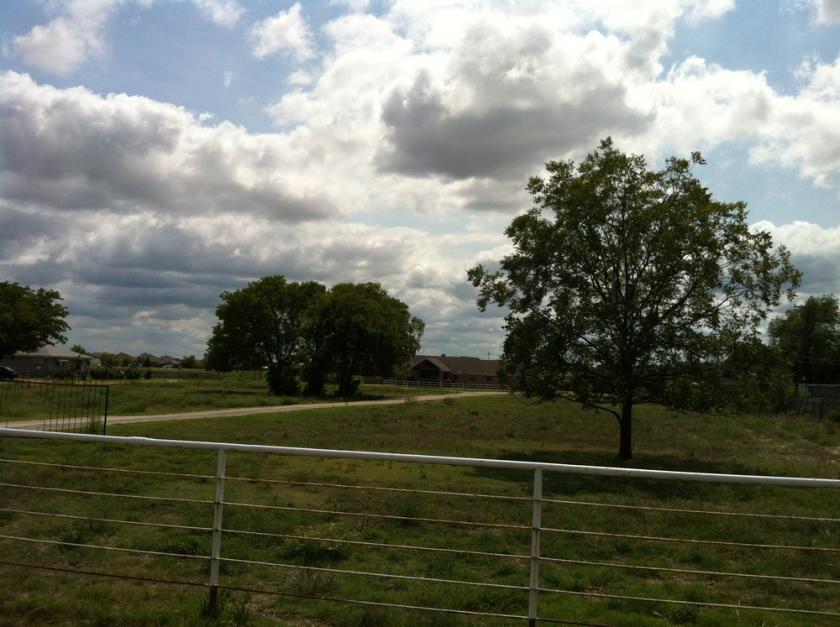
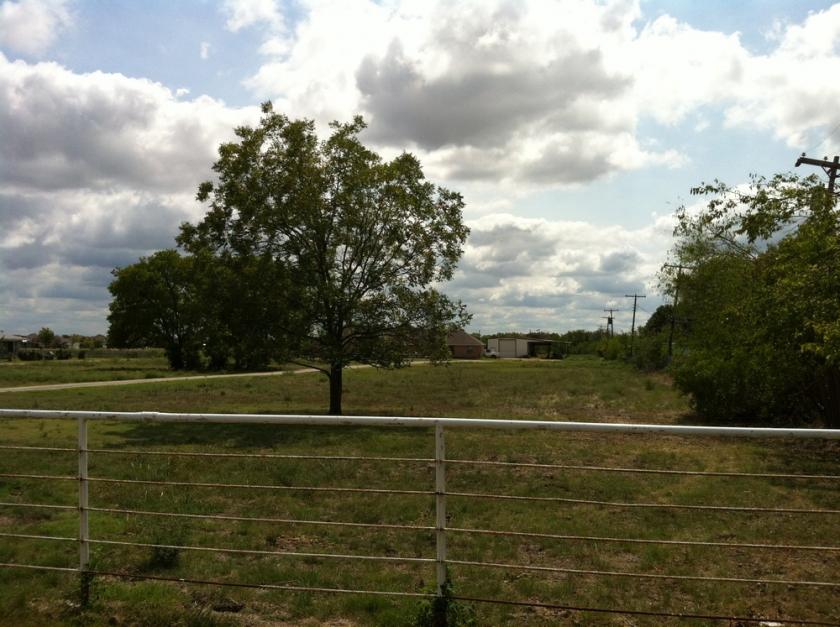
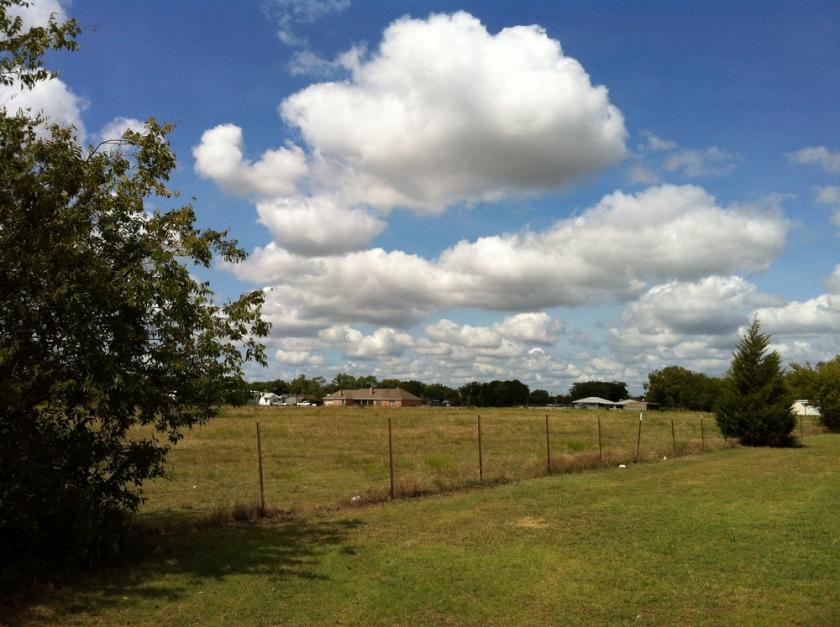
1-Mile | 3-Miles | 5-Miles | ||
---|---|---|---|---|
Total Population | 11,041 | 82,017 | 243,504 | |
Population Median Age | 31 | 33 | 33 | |
Population by Age | 0-9 Yrs | 1900 (17%) | 13114 (15%) | 40363 (16%) |
10-19 Yrs | 2117 (19%) | 13101 (15%) | 40213 (16%) | |
20-29 Yrs | 1211 (10%) | 12050 (14%) | 34106 (14%) | |
30-39 Yrs | 2296 (20%) | 13807 (16%) | 38906 (15%) | |
40-49 Yrs | 1485 (13%) | 11391 (13%) | 35528 (14%) | |
50-59 Yrs | 983 (8%) | 8213 (10%) | 26513 (10%) | |
60-69 Yrs | 718 (6%) | 6426 (7%) | 16613 (6%) | |
70+ Yrs | 332 (3%) | 3914 (4%) | 11261 (4%) | |
Median HH Income | $71,600 | $72,312 | $70,674 | |
Total Household Income | < 24K | 335 (9%) | 2962 (10%) | 9309 (12%) |
25-49K | 603 (17%) | 5131 (18%) | 15415 (20%) | |
50-74K | 885 (26%) | 6091 (22%) | 16058 (21%) | |
75-99K | 484 (14%) | 4731 (17%) | 12812 (16%) | |
100-199K | 1007 (29%) | 7383 (27%) | 19946 (26%) | |
200K+ | 83 (2%) | 869 (3%) | 2909 (3%) | |
Highest Education Level | No Diploma | 1064 | 6616 | 23452 |
Diploma or GED | 1432 | 13129 | 38886 | |
Some College | 1685 | 13073 | 34135 | |
Assoc. Degree | 527 | 4549 | 11753 | |
Bachelors Degree | 1323 | 10056 | 28625 | |
Higher Degree | 518 | 3379 | 10546 | |
Total Housing Units | 3,676 | 28,775 | 80,466 | |
--Owner-Occupied | 2,409 | 16,823 | 50,265 | |
--Renter-Occupied | 988 | 10,343 | 26,183 | |
Owner-Occupied Values | < 100K | 464 | 2941 | 10917 |
100-199K | 1126 | 9728 | 24482 | |
200-299K | 600 | 3343 | 11411 | |
300-399K | 214 | 617 | 2543 | |
400-499K | 1 | 81 | 578 | |
500K+ | 4 | 114 | 334 | |
Total Working Age Population | 7,774 | 60,607 | 177,861 | |
In Work Force | 5,666 | 43,415 | 126,900 | |
Not In Work Force | 2,108 | 17,192 | 50,961 | |
Workforce Employed | 5,151 | 40,659 | 119,237 | |
Workforce Unemployed | 402 | 2,537 | 7,274 | |
Civlian Workforce | 5,553 | 43,196 | 126,511 | |
Military Workforce | 113 | 218 | 389 | |
Total Households | 3,397 | 27,166 | 76,448 | |
Family Households | 2,750 | 19,931 | 58,630 | |
Non-Family Households | 647 | 7,235 | 17,818 | |
Married Couple | 1,949 | 13,953 | 42,451 | |
Other Family | 800 | 5,978 | 16,179 | |
Married w/Child | 1,179 | 7,457 | 23,076 | |
Single Male w/Child | 206 | 1,055 | 2,791 | |
Single Female w/Child | 351 | 2,359 | 6,591 |
Population Change Last Two Decades - Plus Projection
2000 | % | 2010 | % | 2020 | % | 2030 | |
---|---|---|---|---|---|---|---|
Texas | 20,851,820 | +21 | 25,145,561 | +18 | 29,677,668 | +18 | 34,894,452 |
Tarrant County | 1,446,219 | +25 | 1,809,034 | +19 | 2,143,755 | +17 | 2,507,170 |
Total Working Age Population:
Total Households:
Total Working Age Population:
Total Households:
Total Working Age Population:
Total Households: