Commercial Land
201 S Hill Ave Dallas, TX 75226
201 S Hill Ave Dallas, TX 75226
Details & Description
Property Highlights
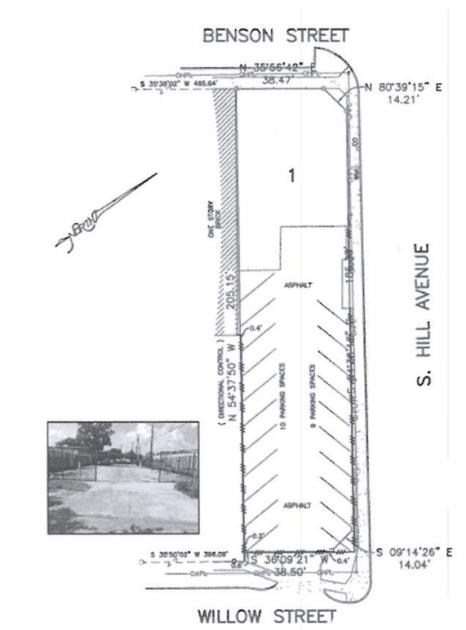
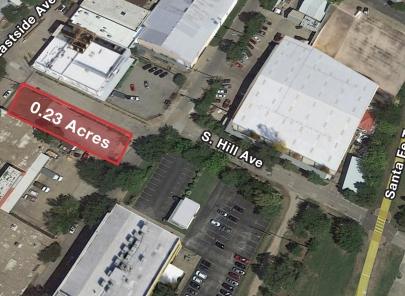
- • Corner lot with paved parking in place
- • Located on outskirts of popular Deep Ellum
- • Santa Fe Trail access
- • Site located outside of flood plain
- • Nearby DART access
- • Eligible for Deep Ellum T.I.F. Credit
Listing Agents

Jayson Montoya
O: 214-256-7136
M: 214-926-7347
jmontoya@nairl.com
O: 214-256-7136
M: 214-926-7347
jmontoya@nairl.com
While we strive to provide the most accurate information, all listing information, and demographic data, is provided by third-parties. As such, MyEListing will not be responsible for the accuracy of the information. It is strongly recommended that you verify all information with the listing agent, and any relevant agencies, prior to making any decisions.