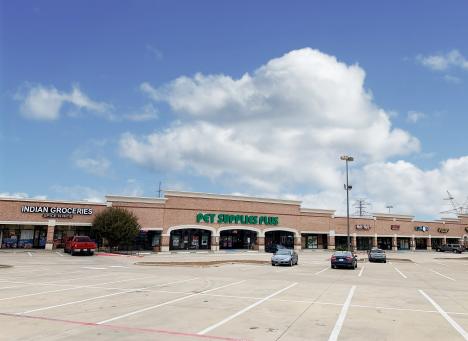
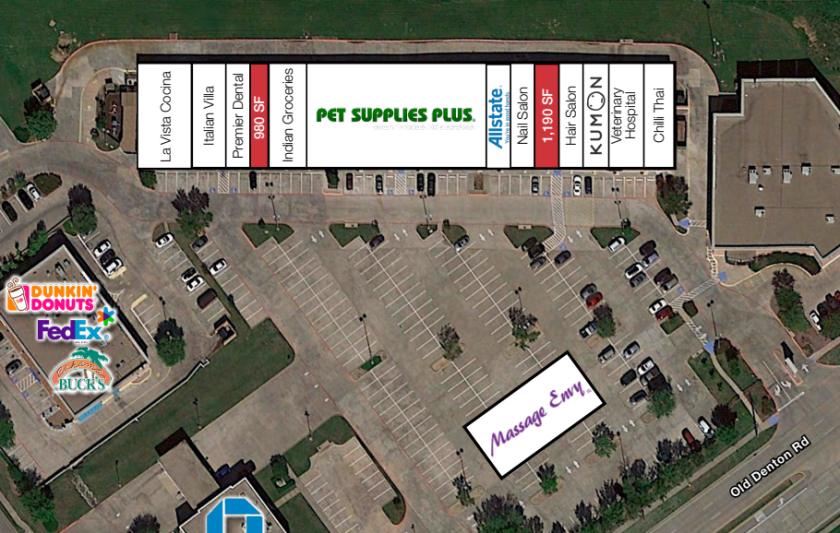
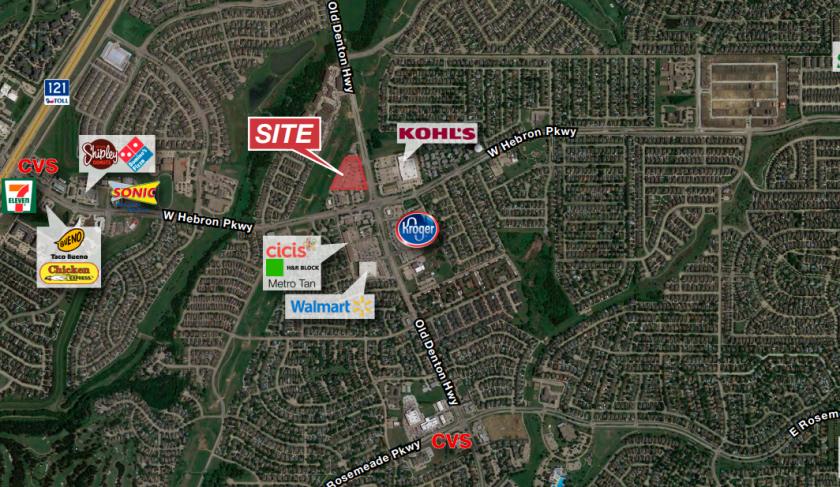
Retail Space
1012 W Hebron Pkwy Carrollton, TX 75010
1012 W Hebron Pkwy Carrollton, TX 75010
Details & Description
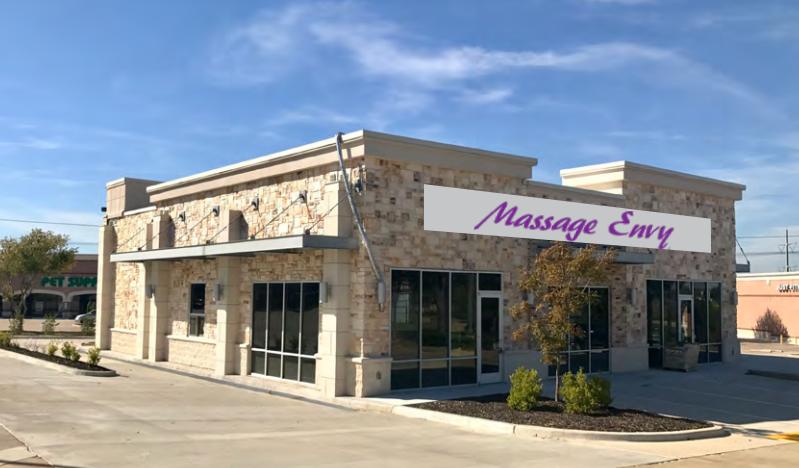
Additional Photos

Listing Agents

Ryan Lee
O: 214-256-7143
M: 972-571-4296
rlee@nairl.com
O: 214-256-7143
M: 972-571-4296
rlee@nairl.com

Dan Avnery
M: 469-231-7171
davnery@nairl.com
M: 469-231-7171
davnery@nairl.com
While we strive to provide the most accurate information, all listing information, and demographic data, is provided by third-parties. As such, MyEListing will not be responsible for the accuracy of the information. It is strongly recommended that you verify all information with the listing agent, and any relevant agencies, prior to making any decisions.


