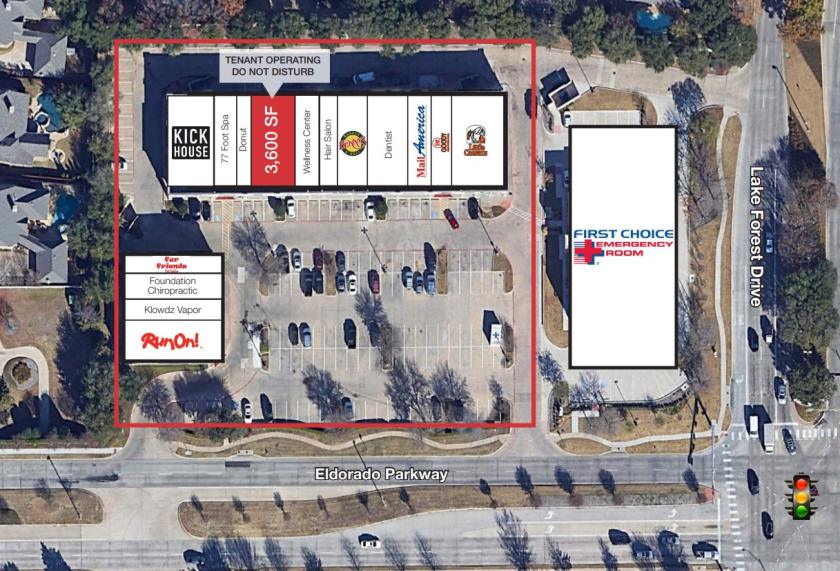
1-Mile | 3-Miles | 5-Miles | ||
---|---|---|---|---|
Total Population | 18,813 | 106,981 | 229,566 | |
Population Median Age | 36 | 35 | 34 | |
Population by Age | 0-9 Yrs | 2693 (14%) | 17150 (16%) | 36160 (15%) |
10-19 Yrs | 2989 (15%) | 17192 (16%) | 38545 (16%) | |
20-29 Yrs | 1471 (7%) | 9884 (9%) | 22587 (9%) | |
30-39 Yrs | 2679 (14%) | 15853 (14%) | 33884 (14%) | |
40-49 Yrs | 3533 (18%) | 18847 (17%) | 41783 (18%) | |
50-59 Yrs | 2615 (13%) | 13337 (12%) | 26495 (11%) | |
60-69 Yrs | 1494 (7%) | 8107 (7%) | 16487 (7%) | |
70+ Yrs | 1339 (7%) | 6610 (6%) | 13625 (5%) | |
Median HH Income | $103,381 | $101,699 | $99,129 | |
Total Household Income | < 24K | 475 (7%) | 2795 (7%) | 6434 (8%) |
25-49K | 832 (13%) | 5019 (13%) | 10891 (14%) | |
50-74K | 1027 (16%) | 5588 (14%) | 11818 (15%) | |
75-99K | 741 (11%) | 5024 (13%) | 10102 (12%) | |
100-199K | 2415 (37%) | 13248 (35%) | 26131 (33%) | |
200K+ | 870 (13%) | 5745 (15%) | 12413 (15%) | |
Highest Education Level | No Diploma | 415 | 2153 | 8289 |
Diploma or GED | 1807 | 7589 | 18504 | |
Some College | 2787 | 14688 | 28886 | |
Assoc. Degree | 1270 | 6261 | 12346 | |
Bachelors Degree | 4179 | 24506 | 48923 | |
Higher Degree | 1663 | 12311 | 26828 | |
Total Housing Units | 6,649 | 39,315 | 81,688 | |
--Owner-Occupied | 4,872 | 26,306 | 53,945 | |
--Renter-Occupied | 1,489 | 11,114 | 23,845 | |
Owner-Occupied Values | < 100K | 83 | 369 | 1682 |
100-199K | 802 | 3356 | 7258 | |
200-299K | 2187 | 8757 | 16182 | |
300-399K | 1207 | 7579 | 14172 | |
400-499K | 301 | 3263 | 7358 | |
500K+ | 293 | 2982 | 7294 | |
Total Working Age Population | 14,183 | 78,781 | 168,497 | |
In Work Force | 9,870 | 55,998 | 119,245 | |
Not In Work Force | 4,313 | 22,783 | 49,252 | |
Workforce Employed | 9,454 | 53,918 | 114,964 | |
Workforce Unemployed | 415 | 2,015 | 4,206 | |
Civlian Workforce | 9,869 | 55,933 | 119,169 | |
Military Workforce | 2 | 65 | 76 | |
Total Households | 6,361 | 37,420 | 77,790 | |
Family Households | 5,147 | 28,887 | 60,749 | |
Non-Family Households | 1,213 | 8,533 | 17,041 | |
Married Couple | 4,137 | 23,983 | 49,931 | |
Other Family | 1,011 | 4,904 | 10,818 | |
Married w/Child | 2,146 | 13,383 | 29,447 | |
Single Male w/Child | 71 | 753 | 1,649 | |
Single Female w/Child | 486 | 2,475 | 5,211 |
Population Change Last Two Decades - Plus Projection
2000 | % | 2010 | % | 2020 | % | 2030 | |
---|---|---|---|---|---|---|---|
Texas | 20,851,820 | +21 | 25,145,561 | +18 | 29,677,668 | +18 | 34,894,452 |
Collin County | 491,675 | +59 | 782,341 | +33 | 1,039,369 | +34 | 1,391,461 |
Total Working Age Population:
Total Households:
Total Working Age Population:
Total Households:
Total Working Age Population:
Total Households: