Industrial Properties
4401 Samuell Blvd Mesquite, TX 75149
4401 Samuell Blvd Mesquite, TX 75149
Details & Description
Property Highlights
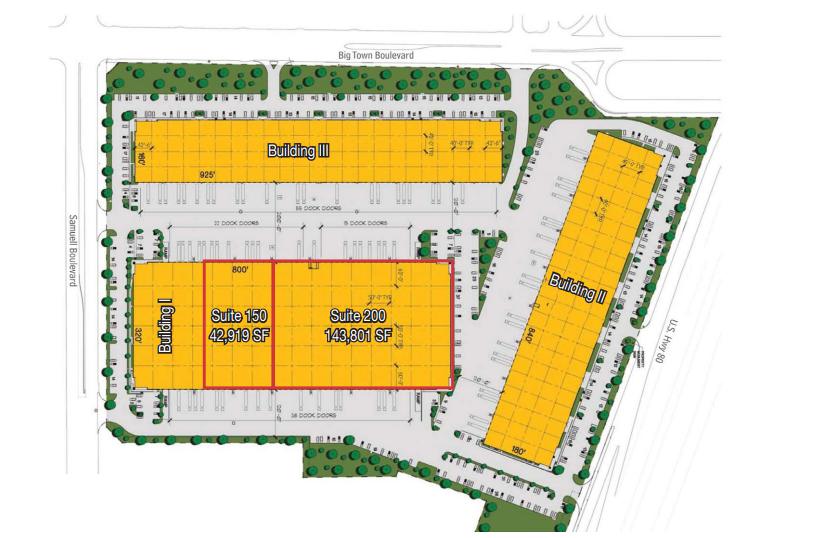
- • 30’ Clear Height
- • Cross Dock Configuration
- • ESFR Sprinkler System
Listing Agents

Stephen Cooper
O: 214-256-7160
M: 214-497-0730
scooper@nairl.com
O: 214-256-7160
M: 214-497-0730
scooper@nairl.com
While we strive to provide the most accurate information, all listing information, and demographic data, is provided by third-parties. As such, MyEListing will not be responsible for the accuracy of the information. It is strongly recommended that you verify all information with the listing agent, and any relevant agencies, prior to making any decisions.