Industrial Properties
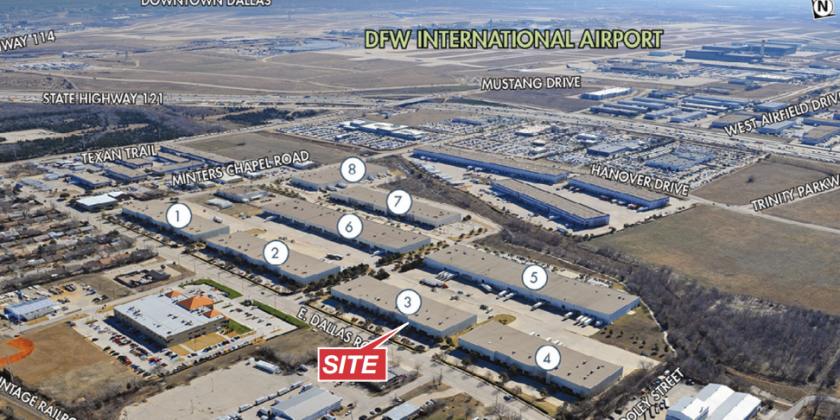
600 E Dallas Rd Grapevine, TX 76051
600 E Dallas Rd Grapevine, TX 76051
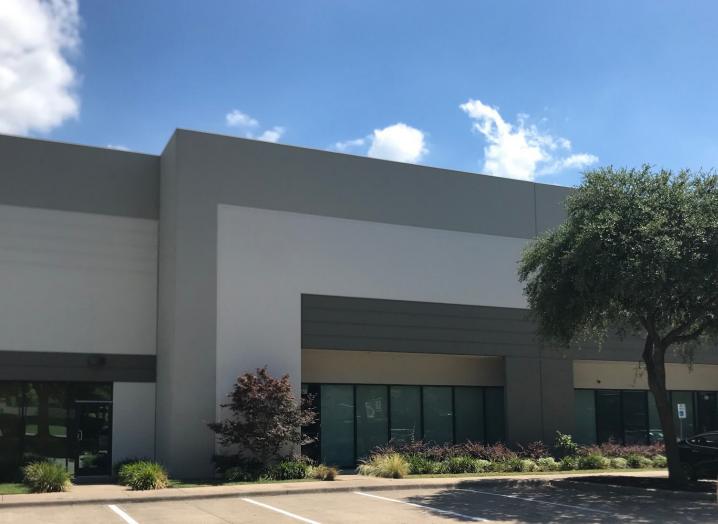
Details & Description
Property Highlights
- • Suite 100
- • 3,340 SF Office
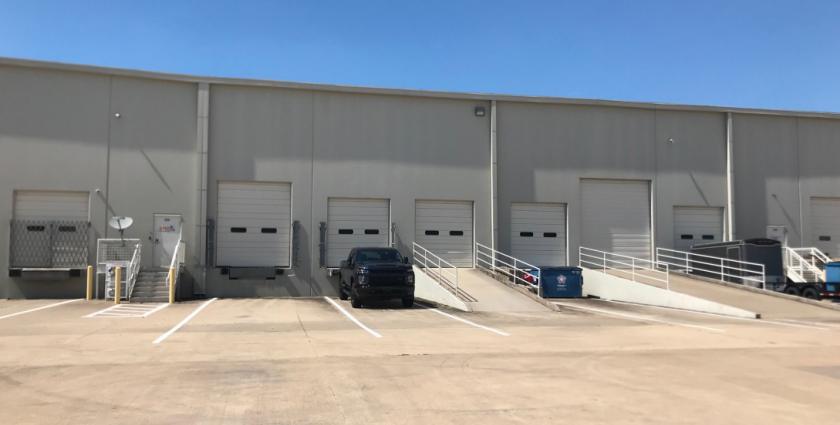
- • Rear Load End Cap
- • 24’ Clear Height
- • 4 Dock Doors with EOD Levelers
- • ESFR Sprinkler System
Additional Photos

Listing Agents

Rick Medinis
O: 214-543-1248
M: 214-256-7116
rmedinis@nairl.com
O: 214-543-1248
M: 214-256-7116
rmedinis@nairl.com

Tyson Erwin
O: 214-256-7127
M: 214-514-6993
terwin@nairl.com
O: 214-256-7127
M: 214-514-6993
terwin@nairl.com
While we strive to provide the most accurate information, all listing information, and demographic data, is provided by third-parties. As such, MyEListing will not be responsible for the accuracy of the information. It is strongly recommended that you verify all information with the listing agent, and any relevant agencies, prior to making any decisions.


